|
|
So what can we do to improve database performance?
Grafana helps you identify and tackle performance issues by giving you the tools you need to analyze and monitor your database. Not only does it help solve problems, but it also aids you in becoming proactive with your maintenance by using alerts. Grafana is open source, compatible with a wide range of databases, and has a thriving community.
This Grafana tutorial will cover the installation, configuration, and creation of your first dashboard using Grafana to monitor a MySQL database.

What Is Grafana?
Grafana is a database analysis and monitoring tool. It allows you to create dashboard visualizations of key metrics that are important to you. Grafana has a thriving community of enthusiasts who share reusable dashboards.
Grafana supports a huge number of data sources. And, since the application is open source, you can be sure that the moment a new data source has been released, someone out there is adding support for it. The most common use case of Grafana is displaying time series data, such as memory or CPU over time, alongside the current usage data.
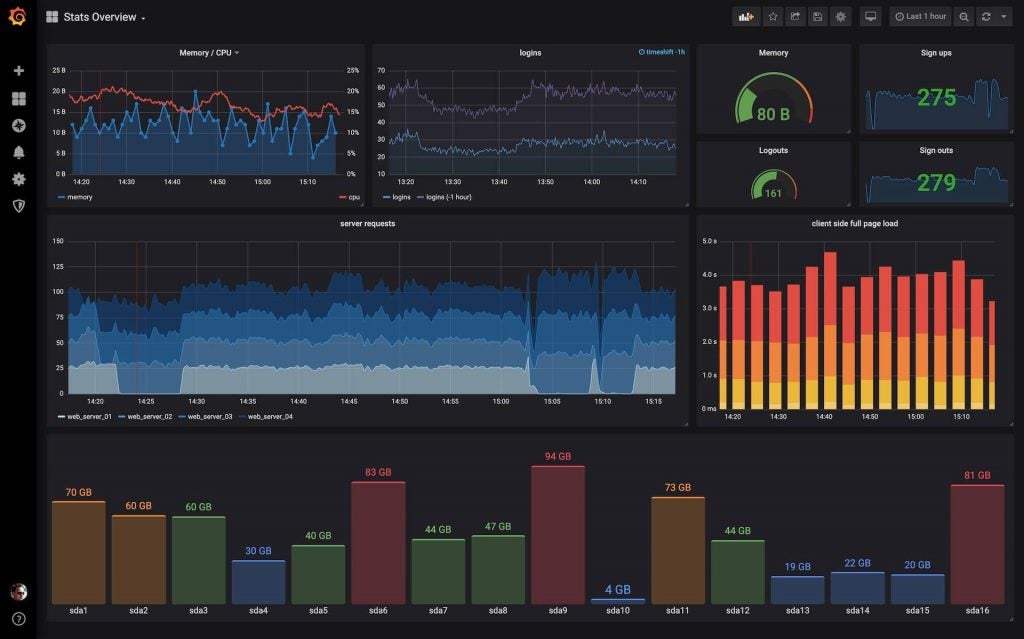
You can host Grafana yourself, use the managed service in AWS or get the creators to host it for you. Grafana runs as a process on your computer or server, and you access the interface through your browser. Your dashboard can display your data as single numbers, graphs, charts, or even a heat map. Below is an example dashboard set up through the Grafana web interface:
Installing Grafana Locally
The instructions for installation depend on where you plan to run Grafana. I normally run applications like this locally to get a feel for how it works before deploying remotely. Grafana provides comprehensive instructions for wherever you want to deploy it.
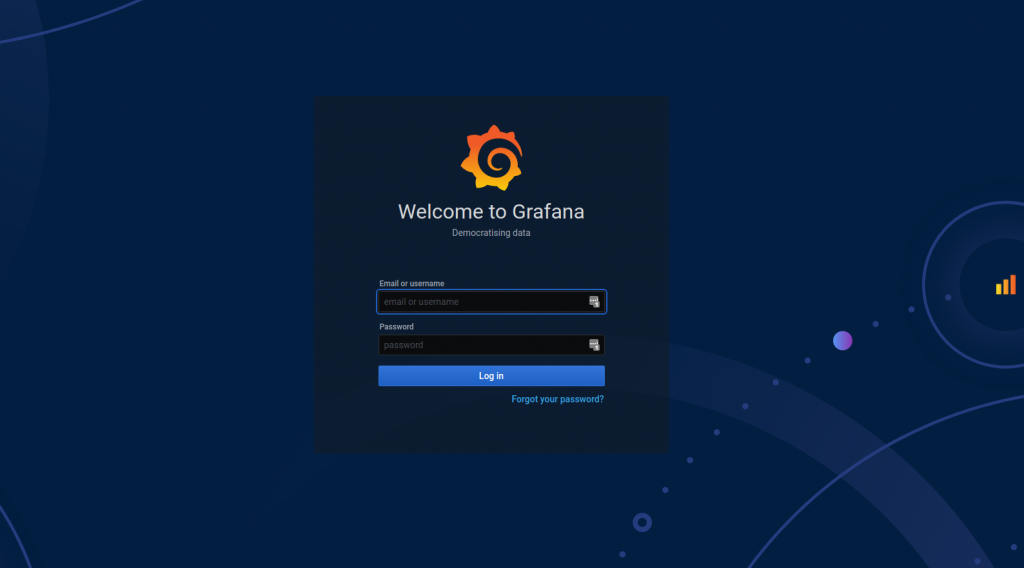
If the installation was a success, then Grafana should be available through your web browser by default on http://localhost:3000, and your screen should look like the image below. The default username is admin and the default password is also admin. You will be asked to change your password after logging in.
Configuring Your DataSource
Configuring your data source is the first step to setting up your Grafana dashboard. Your data source could be a database or a collection of logs. Grafana supports pretty much every data source you can think of, from traditional databases like MySQL to log aggregation platforms like AWS Cloudwatch.
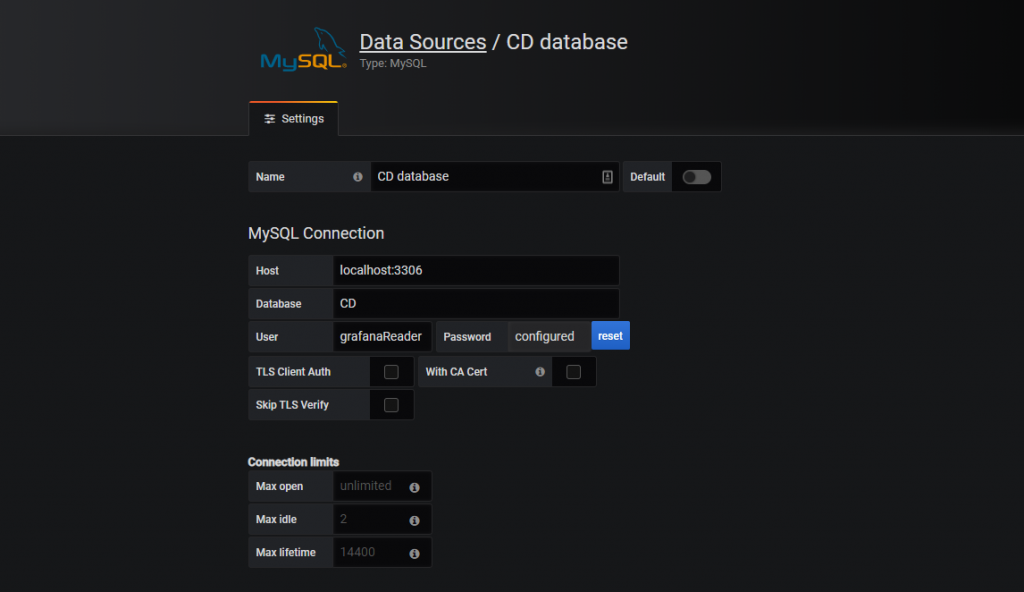
Now we’ll walk through configuring Grafana to connect to your MySQL database. For my example, I’ve created a database named CD with a table called Artist to simulate a database behind a music library app.
Your first step is to add a Grafana user to your database. In your MySQL database, run the following in the database administrator role to add a read-only user named grafanaReader to your database CD for the table Artist:
CREATE USER 'grafanaReader' IDENTIFIED BY 'password';
GRANT SELECT ON CD.Artist TO 'grafanaReader';
To add a link from your database to Grafana, switch back to the Grafana interface.
The first option on the display is Create your first datasource. Complete the web form with your connection details. I’m using a local MySQL database running on localhost on port 3306 for the database CD and with the user we made previously, grafanaReader. It’s safe to leave the rest of the fields as default. Hit save and test. If everything is configured correctly, you should see a green box with the message Database Connection OK.
Create Your First Dashboard
Now that your database is connected, you are ready to create your first dashboard! I’m going to create a dashboard showing stats about the CD database we connected in the previous section.
Dashboards are made from panels of information organized into rows. I’m creating a dashboard from one datasource, but you can use different data from different sources in the same dashboard.
Panels represent a visual representation of a query. Each panel can show the same or different data using a visualization that is the easiest for you to process. The first panel will show the total number of Artists in our CD database.
Single Stat Panel
To show a single number, we use the single stat panel. Switch back to Grafana again. You now have the option create your first dashboard. Choose this option, then select Add new panel.
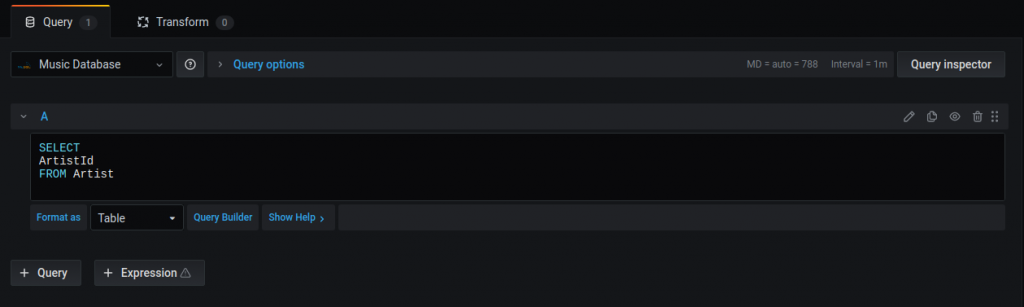
Select your database from the Query drop-down menu and choose to format this query as a table in the format as drop-down. Select the Edit SQL link and paste the following SQL:
SELECT ArtistIdFROM Artist
This assumes you have a table called Artist and a column named ArtistId. You can change the names of the column and the table to fit your data. Your Query page should look like the screenshot below:
On the right hand side on the panel tab expand the Visualization menu and choose the stat icon. This will immediately give you a preview of your panel showing the sum of records in your table.
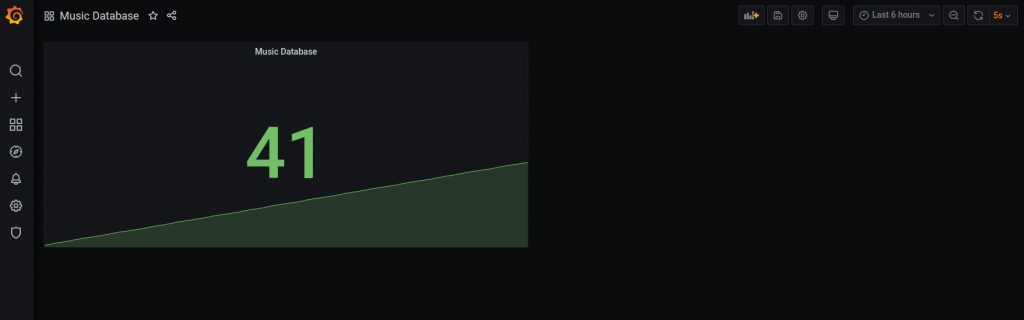
Finally, click the settings icon to give the panel a meaningful name, such as Total Artists. You have now created your first panel! You also now have a dashboard with a single panel. Something like the view below:
At the top right of the screen, you can select how often the database will be queried to get up-to-date information. Set it to 5s to refresh the box every 5 seconds. You can now change the data in your database and see the update on the screen!
Easily Share Your Grafana Dashboard with Others
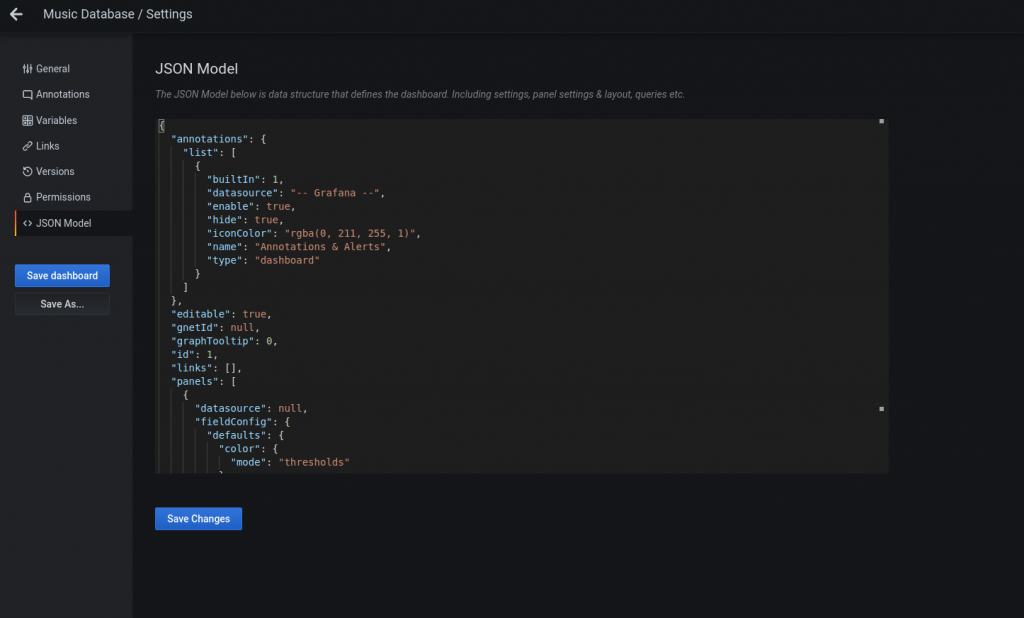
A feature that makes Grafana really popular is the ability to easily share dashboards with others. To export your dashboard, select the cog icon at the top right of your dashboard. The tool tip will read Dashboard Settings. Select JSON Model from the left navigation menu and you can see your dashboard as JSON. Sharing your dashboard is as simple as saving this file and passing it to someone else to load into their instance. Below shows how my dashboard looks as JSON.
Make Impressive Dashboards with Help from Scalyr
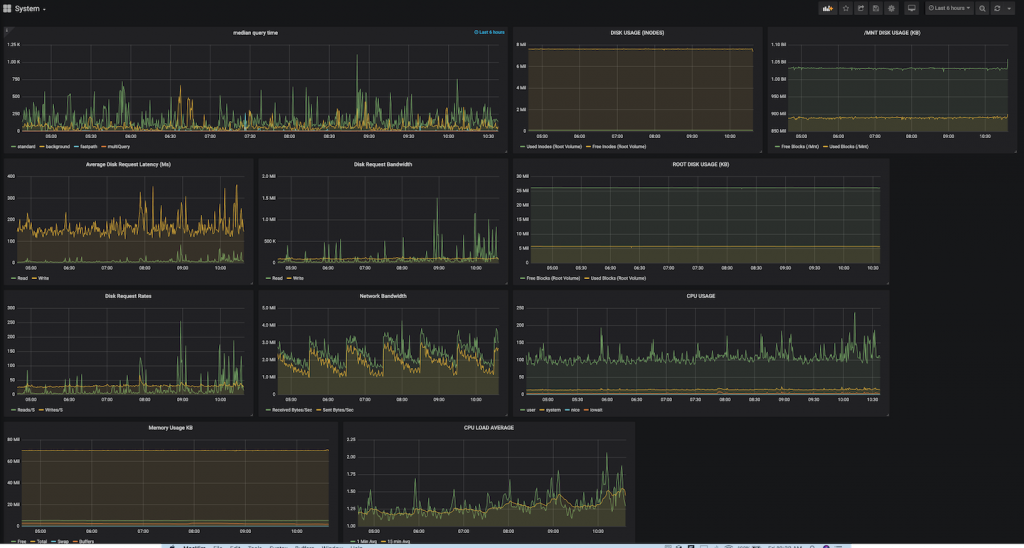
Having a dashboard with the number of records in your database is useful–but not very impressive. I normally start my dashboards using existing logs. If you don’t already have a central place to store the logs from different parts of your application, try Scalyr with your Grafana dashboard now. You can add Scalyr as a data source to your dashboard using an open source plugin. With the plugin you can view log based metrics in Grafana, then click straight through to the Scalyr site to view your logs in more detail. The dashboard below shows an example of the impressive dashboards you can make with Scalyr.
Grafana Can Display All Your Data in Whatever Format Works Best
Grafana is an open source database analysis and monitoring tool that is easy to install on any operating system. It’s accessed through a browser, so it can be deployed to your favorite hosting company and can then be accessed by your whole team.
You can display all your data (even from multiple sources) in whatever format works best for you. There is a wide selection of visualizations built in and accessible through the community. You can customize your panels with color and transparency—whatever makes sense for your visual. You can even make your own visualization plugins if you want something a little more specific to your use case.

In this Grafana tutorial, you learned how to set up your first dashboard. There is loads more to learn, and I highly recommend joining the community to share your creations. You can learn some of the best practices and learn from the experts who have been creating these visuals for years.
Grafana is not just for when you have performance issues. You can proactively set up alerts to notify you when a value reaches a threshold to keep one step ahead of your performance issues. The dashboard looks so good that you’ll soon be putting monitors with all your dashboards up all over the office. It can become an obsession!