|
|
Summary: Most server problems, once identified, can be quickly solved with a simple compensating action—for instance, rolling back the bad code you just pushed. The worst outages are those where reversing the cause doesn’t undo the effect. Fortunately, this type of issue usually generates some visible markers before developing into a crisis. In this post, I’ll talk about how you can avoid a lot of operational grief by watching for those markers.
The DynamoDB Incident: a Cautionary Tale
On the morning of September 20th, Amazon’s DynamoDB service experienced a serious production incident lasting five hours. Based on Amazon’s postmortem, the story can be summarized as follows:
- DynamoDB’s “storage servers” periodically retrieve metadata from a metadata service. A relatively new DynamoDB feature had, without anyone noticing, increased the amount of metadata to the point where the metadata servers were barely able to process requests in less than the timeout period.
- A “brief network disruption” temporarily prevented some storage servers from communicating with the metadata service.
- When the network disruption was resolved, the affected storage servers simultaneously attempted to reload their metadata. This surge caused the metadata requests to take longer than usual, pushing them over the timeout threshold.
- These timeouts caused further failures and retries, creating a failure cascade and preventing the system from returning to a healthy state.
If you’re an operations engineer, this is the kind of story you hate to get mixed up in. Out of nowhere, your system is down, and there’s no obvious path to bring it back up.
Most outages aren’t like that. Usually, to resolve an issue, you simply undo the action that caused it. A power supply failed; swap in a replacement. You pushed a bad build; roll it back. Your SSL certificate expired; smack yourself on the forehead and issue a new one. These types of fixes are usually straightforward.
The worst outages stem from irreversible failures, where there is no simple compensating action you can make. In this DynamoDB incident, the initial triggering event—the network disruption—was quickly repaired. However, the system was now stuck in a state where the metadata service was overloaded. Fixing the network didn’t eliminate the overload. Amazon’s engineers were forced to invent a lengthy procedure, on the fly, to steer the system back to a stable state.
Ounces of Prevention, Pounds of Cure
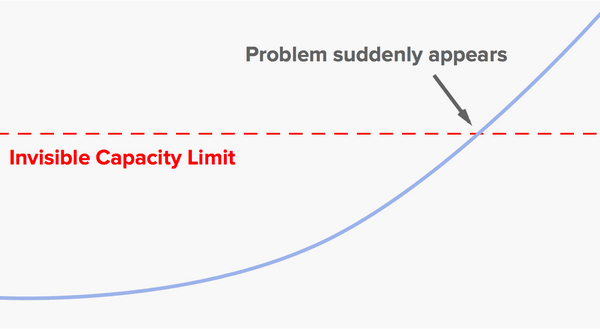
These types of problem are usually much easier to deal with if you can spot them in advance. And you often can spot them. The DynamoDB incident, like many such incidents, was in large part a capacity problem caused by growth in usage over time. Growth problems usually don’t look like this:
Real-world usage patterns are noisy, and here that works to our advantage. A typical scenario looks more like this:
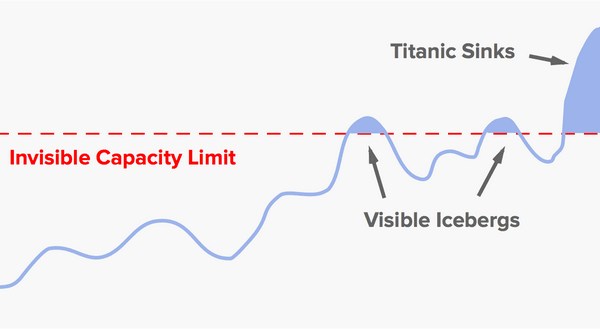 Random fluctuations will cause the system to brush up against the limit a few times before it crosses over completely. This creates “iceberg tips” — brief bursts of timeouts or error messages. If you have a noisy system, with an ongoing background rate of errors, then you may not be able to notice the iceberg tips. But if your system is healthy enough to keep “normal” errors to a minimum, then these small bursts of errors should stand out.
You’re more likely to spot icebergs if your team is in the habit of investigating every little issue that arises in production. Good tools, like Scalyr’s monitoring and log management service, can help—our customers routinely report that our speed and simplicity leads to more team members investigating more issues. (Full disclosure: You’re reading these words on the Scalyr blog.)
We had a recent instance of this here at Scalyr. Every 60 seconds, we evaluate many thousands of alert conditions on behalf of our customers. If it were ever to take more than 60 seconds to evaluate all the alerts, we’d fall behind. We had a few isolated incidents where the system was under stress and alert evaluation took more than 20 seconds—not long enough to cause a problem, but long enough to trip an internal alert. We investigated, saw that increased usage had left us with less headroom than we like, and tuned the system to evaluate alerts more quickly. Because we’d detected the problem early, we were able to address it on a convenient schedule.
A Public Service Announcement Regarding Cascading Failures
Capacity problems are a common type of failure, and often they’re of this “cascading” variety. A system that’s thrashing around in a failure state often uses more resources than it did when it was healthy, creating a self-reinforcing overload. Here are some best practices to avoid this trap:
- Always make sure you have plenty of extra capacity, or can quickly add more. Protip: “extra capacity” has a tendency to turn into “utilized capacity.” Set an alert to notify you when usage starts to approach capacity.
- Implement load-shedding mechanisms. Your servers should return 429 (“Too Many Requests”) when overloaded, and your clients should respect that by using truncated exponential backoff.
- Make it easy to reduce load on the fly, by making parameters such as timeouts, retry intervals, and cache expiration times adjustable through a simple configuration change. If you can recover from an outage by twisting a few knobs, that’s much easier than creating an emergency build or adding new capacity.
Further Reading
Here at Scalyr, we hate middle-of-the-night alerts almost as much as cascading failures. A while back we published a post, 99.99% uptime on a 9-to-5 schedule, where we say more about how to spot problems—including capacity problems—in advance. For more a more general tutorial on how to detect incipient problems, check out our article Zen and the Art of System Monitoring.