|
|
We’ve been writing about logging with programming languages like Go, C++, Java, Node.js, and others. And today the time has come to write about how to get started with logging in Kubernetes. This topic is quite extensive as there are many components to consider before having a complete perspective of what’s happening inside your applications. Once you deploy your applications to Kubernetes, you have to be careful that you don’t miss important information in its logs.
Hence, today’s post gives you an introduction to recommended practices, tools, patterns, and strategies for logging in Kubernetes. You’ll learn that instrumenting your application to emit logs is not going to be enough. By default, Kubernetes emits a lot of logs from all its components, so you’ll have a lot of information. You’ll have to know where to look and how to manage all of those logs.
So, let’s start with the simplest way of reading logs in Kubernetes. 
Starting With Kubernetes Logging
First, we need to review how logging works in Docker containers. And I’m focusing on Docker containers because nowadays, Docker is the most common approach to packing applications for Kubernetes. If you want to read logs from a container, the command to do it is the following:
docker logs [OPTIONS] CONTAINER
By default, the above command reads the logs that the container sends to STDOUT or STDERR. You can take a look at the official NGINX Dockerfile for an example of how access and error logs are redirected to the Docker log collector. However, a container can be configured to send logs somewhere else, like AWS CloudWatch. For now, let’s stay with the default logging behavior in Docker. Later, I’ll explain how you can achieve the same in Kubernetes.
To get started, you need to install the kubectl tool and be familiar with how to connect to a Kubernetes cluster. Then, create a pod with an NGINX container using the following command:
$ kubectl run nginx --image=nginx --generator=run-pod/v1
Wait some time, typically around three minutes, while Kubernetes creates the pod. When the state changes to Running, you can start reading the container logs.
$ kubectl get pods
NAME      READY     STATUS    RESTARTS   AGE
nginx     1/1       Running   0          6s
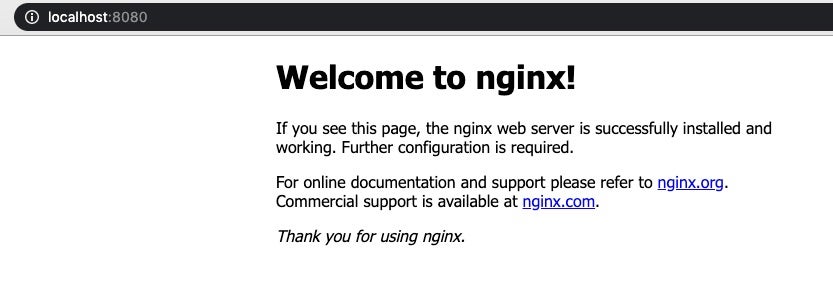
Now, let’s use the port forwarding feature to access the NGINX server at port 8080 on your workstation:
$ kubectl port-forward nginx 8080:80
Forwarding from 127.0.0.1:8080 -> 80
Forwarding from [::1]:8080 -> 80
Open your browser and explore the site at port 8080. You should see something like this:
Reading the Logs
Every time you visit the local site, an access log is written inside the container. If you want to take a look at the log, open a new terminal and run the kubectl logs command. The output will look like this:
$ kubectl logs nginx -f
127.0.0.1 - - [26/Feb/2020:22:07:05 +0000] "GET / HTTP/1.1" 200 612 "-" "Mozilla/5.0 (Macintosh; Intel Mac OS X 10_14_6) AppleWebKit/537.36 (KHTML, like Gecko) Chrome/79.0.3945.130 Safari/537.36" "-"
2020/02/26 22:07:07 [error] 6#6: *2 open() "/usr/share/nginx/html/favicon.ico" failed (2: No such file or directory), client: 127.0.0.1, server: localhost, request: "GET /favicon.ico HTTP/1.1", host: "localhost:8080", referrer: "http://localhost:8080/"
127.0.0.1 - - [26/Feb/2020:22:07:07 +0000] "GET /favicon.ico HTTP/1.1" 404 555 "http://localhost:8080/" "Mozilla/5.0 (Macintosh; Intel Mac OS X 10_14_6) AppleWebKit/537.36 (KHTML, like Gecko) Chrome/79.0.3945.130 Safari/537.36" "-"
127.0.0.1 - - [26/Feb/2020:22:07:10 +0000] "GET / HTTP/1.1" 304 0 "-" "Mozilla/5.0 (Macintosh; Intel Mac OS X 10_14_6) AppleWebKit/537.36 (KHTML, like Gecko) Chrome/79.0.3945.130 Safari/537.36" "-"
127.0.0.1 - - [26/Feb/2020:22:07:34 +0000] "GET / HTTP/1.1" 304 0 "-" "Mozilla/5.0 (Macintosh; Intel Mac OS X 10_14_6) AppleWebKit/537.36 (KHTML, like Gecko) Chrome/79.0.3945.130 Safari/537.36" "-"
And that’s how logging in Kubernetes works, in simple terms. You need to make sure that the application inside the container is emitting logs to STDOUT or STDERR. Then, you can read those logs using the kubectl tool. You can read just the last few log lines, or you can attach the terminal to read logs in real-time.
Next, because using the kubectl doesn’t scale, I’ll explore other ways to work with logs in Kubernetes. Imagine running several kubectl commands when you have to operate thousands of pods. Using kubectl logs works fine for debugging an application quickly. But there are better ways to do it.
What’s the Motivation Behind Logging?
In general, the motivation behind logging is to understand what’s happening inside your systems. There may be times when reproducing a problem is difficult. You need to have information about what happened at a certain time—especially when there’s an incident in a live environment and you need to find the root cause. You need observability, which is the ability to ask questions from the outside to understand the internals of the system. But to have observable systems, you first need to instrument your applications—more on this later. In the case of Kubernetes, you already have some default logs from each of the system’s components, like the API server, the scheduler, and the controller.
Moreover, it’s likely that when you go the Kubernetes route for managing your systems, you’ll be working with a distributed system, like microservices. When you have a lot of pieces in your system, logging becomes one of the most critical features of the system.
Let’s explore, then, what your applications should be logging when running on Kubernetes.
What Should You Log in Applications for Kubernetes?
To get a better idea of what you need to log, ask yourself, “What would you like to see in a log when debugging?” And if you’re new to Kubernetes, you might not even know what information would be useful. Therefore, I’ll give you a list of application properties that you might find valuable when troubleshooting.
Kubernetes has valuable information that you can use at runtime. As you may know, Kubernetes stores all the information about workloads (including Kubernetes components) in an etcd database. And you can consume that information through the Kubernetes API. But as mentioned earlier, you have to instrument your applications so that they can emit the logs you need. For instance, you can use projects like Logrus if your application is written in Go.
Here’s a short list of properties you might want to include in your logs and why you might use them:
- Date and time of events in a standard time zone, like UTC.
- Application names, so that you can identify the application or microservice.
- Pod names, because this is what you’ll use to investigate if the problem is in Kubernetes or not.
- Pod IP, in case you want to tune in-network security policies or if you’re having communication issues.
- Container name, because you might have more than one container in a pod.
- Namespace name, in case you’re sharing the cluster with other workloads.
- Worker node name, to identify a Kubernetes node you’re having problems with.
- The name of the service account (if any), in case you’re having permission problems within your pod.
You can take a look at an example from the official Kubernetes documentation site where they expose all of this information through environment variables. Once you have those, you can instrument your applications and use the environment variables when logging.
Architectural Patterns for Application Logs
After instrumenting your applications, there are a few options for consuming logs. You need to pay attention to how you consume logs to make sure you don’t sacrifice performance. Ironically, I’ve been on projects where we had downtime in production because the tooling we used for logging was down. So, you must know your needs with regard to performance. If you need to offer low latency, every extra call in the system counts. Each call will add extra milliseconds to the response time. Moreover, your system shouldn’t be down because you’re having problems with consuming logs. Practice chaos engineering by thinking in terms of which ways your logging systems can be down.
Next, I’ll briefly explain a few architectural patterns, along with their trade-offs.
Sending Logs Over the Network
The first option is to send the logs directly to their destination. That is, you instrument your applications to consume an HTTP endpoint, including the payload of the log. You can think about this option as calling another microservice. Although this is an easy option to implement, your outbound network traffic will increase. You might need to have higher-capacity servers if your application needs to support high network throughputs.
Exposing an Endpoint for the Application Logs
Instead of pushing logs to a location, you can expose an endpoint where others can consume logs. For instance, Prometheus works this way, at least by default. A system that wants to consume logs will have to pull logs from your applications only when it’s needed. Think about this approach as SSHing to the server. If you’re occasionally in need of logs from an application, exposing an endpoint might be a good approach.
Using a Sidecar Container
You can have more than one container within a pod, and these containers will share resources. For instance, because containers in a pod will be colocated, they can share a location from the host. This means that the application can write logs to a location inside the container, like /var/log/. And you can configure this location as a volume to another location in the host. Then, you can have a sidecar container with the same volume configuration as the application. This sidecar container will contain logic to consume logs and process them. With this architectural decoupling, you have more freedom in how to treat logs without having to change the application. The application will only have to write logs to one location.
Installing an Agent in the Worker Node
A similar approach is to use a DaemonSet. Instead of injecting a container to a pod to consume application logs, you can deploy a pod to all worker nodes. This reduces the number of logging containers in the cluster because you’ll have only one. However, every change you make has to apply to all pods in the cluster. And each application has to have a way to differentiate its logs from other applications in the cluster.
You can read more about these patterns in the Kubernetes official documentation site.
What Other Logs Are Available in Kubernetes?
As I mentioned earlier, Kubernetes has other logs available to correlate events when something goes wrong inside the cluster. Sometimes, application logs aren’t enough. You can use other types of logs to automate things. One example is auto-scaling when Kubernetes can’t schedule more pods. To get the most out of these options, you need a basic understanding of Kubernetes architecture. Below, I’ll briefly explain a few of the core Kubernetes components.
Master Control Plane Logs
If you’re new to Kubernetes, the control plane is the set of servers where the components in charge of making global decisions run. These components are the API server, the scheduler, the controller manager, and etcd. So, if for some reason you don’t see that more pods are being created in the cluster, you might want to check the logs. It won’t matter if your applications have instrumentation in place because errors like this are happening in a different layer. For instance, things like scheduling, scaling, or deployments are not related to your application.
When you have access to the control plane servers, you’ll find logs at these locations:
- API server logs are at /var/log/kube-apiserver.log
- Scheduler logs are at /var/log/kube-scheduler.log
- Controller manager logs are at /var/log/kube-controller-manager.log
However, it’s a different situation if you’re using a Kubernetes-managed service in the cloud. In that case, you won’t have access to the control plane servers. But everything is not lost! For instance, if you’re using AWS, you can enable the control plane logs in EKS and read them in CloudWatch. If you’re using Azure, you can enable and view logs from AKS. And in Google, you have the same capability with the Kubernetes engine monitoring.
Worker Node Logs
In worker nodes, you’ll find the components in charge of running containers in the node (kubelet) and components offering service load balancing (kube-proxy). You can find the logs at these locations:
- For the kubelet, look at /var/log/kubelet.log, or you can use journalctl -u kubelet to read logs
- And for the kube-proxy, look at /var/log/kube-proxy.log
If you’re using Docker for the container engine, as almost everyone does, you might need to check the Docker daemon logs as well. Depending on the operating system, you’ll find the logs in different locations. For instance, in Debian, you can find the logs at /var/log/daemon.log. If you’re using Ubuntu, it’s better to use the journalctl -u docker.service command. You can get more in-depth information about troubleshooting the Docker daemon at the official Docker documentation site.
Audit Logs
You can record every call made to the Kubernetes API through the audit logs, for either debugging or for security purposes. For instance, you might want to know what happens when you do a deployment of the application. Or, you can troubleshoot authentication issues within the cluster. Audit logs are not enabled by default; you have to enable them. You can even pick which logging levels you want. And you can choose where to store the logs for longer retention. For instance, you can configure an audit policy to record calls to secrets and configmaps. Then you can configure the policy to write logs on the server disk. This allows you to use tools like fluentd to forward logs to a centralized location.
Also, audit logs already work in major cloud providers (take a look at the links I shared in the control plane section). When you enable audit logs, you can do interesting things automatically, like blocking access to certain users.

Keep All Kubernetes Logs Together
In Kubernetes, you can consume several types of logs. But to get useful insights from all these logs, you’ll need to keep all of them together. Centralized logging becomes crucial in distributed systems like those you run Kubernetes in. When you have all the logs at the same place, you can go deeper when troubleshooting.
Keep focused on having good instrumentation in place for your applications. When your applications run in Kubernetes, you’ll find it useful to log information like which namespace the pod for the application is running in. You can identify permission issues by using complementary information like audit logs.