|
|
You may have heard about log analyzers before, or this may be the first time you are reading about them. Whatever your unique case is, let me paint a picture.
Tax time is coming. You have 10 bank accounts ranging from IRAs, stocks, and checking. It’s a mess, and you need to figure out what to report to the IRS on tax day.

What do you do? You hire an accountant. Accountants have the ability to organize this information in a way that you can search and report on.
In this post, I’ll explain why a log analyzer is like an accountant for your code and why it’s so handy to have. I’ll also share insights from my experience with log analysis.
Read on, draw parallels with your organization, and infer your own conclusions. Learn how a log analyzer helps you.
An Accountant for Your Software
One of the useful things an accountant does is collect your financial information and meticulously store it into ledgers. Each ledger tells a story for each transaction made in a period of time.
To search through those transactions, you need criteria like the date and amount paid. You find the transaction log and it has more information: payment method, recipient, plus other details.
A log analyzer is like an accountant for your software in this way. It collects your software transactions into one place, timestamped and searchable so that you can report on the state of your application.
That’s what a log analyzer does: it helps you find events in a collection so you can study them and fix problems.
Let’s take a closer look at how it does this.
Log Analyzer: An Ideal Case
- An incident report provides data for log analysis.
- Someone reproduces this issue based on your log data.
- Your development team proposes a solution in a new fixed app.
- Someone reproduces the incident again, this time using your new app.
- Log analysis and testing show whether this fix was effective or not.
Imagine, how would you know the fix was in place without visibility into your app’s logs? What if you had to search file-by-file for the right events, instead of searching them by keywords in seconds? What if your users had to re-click a button every time a bug occurs?
With a log analyzer, we resolve these problems and can have the ideal case.
Collect, Aggregate, and Process Logs
Let’s go back to our accounting analogy. But this time, imagine you’re keeping the records for many people, like a bank.
Banks maintain thousands of accounts, recording transactions in ATMs, shops, online banking, etc. All these records are consolidated in a single source of truth.
In the software world, we call this single source of truth a “centralized log,” which allows you to:
- Collect relevant details from transactions happening in a certain scope.
- Put them all in the same place under standard rules for common fields like the date.
- Implement a log analyzer to index, search, sort, filter, and visualize data in meaningful ways.
Start With Standard Services, Save Business Applications for Later
Most log analyzers have sets of plugins that gather data from standard tools like web servers, databases, and operating systems.
The plugins require minimal setup time and they’ve been extensively tested. Implement these first so you can see quick results with low effort.
Now it’s time to feed your application logs to your log analyzer.
Review the documentation and choose a supported log format. With Scalyr, this process involves uploading files, providing configuration for each log, and then manipulating your data based on your needs.
Some analyzers allow you to add third-party sources to your analysis. This empowers you to correlate your application logs with other data sources.
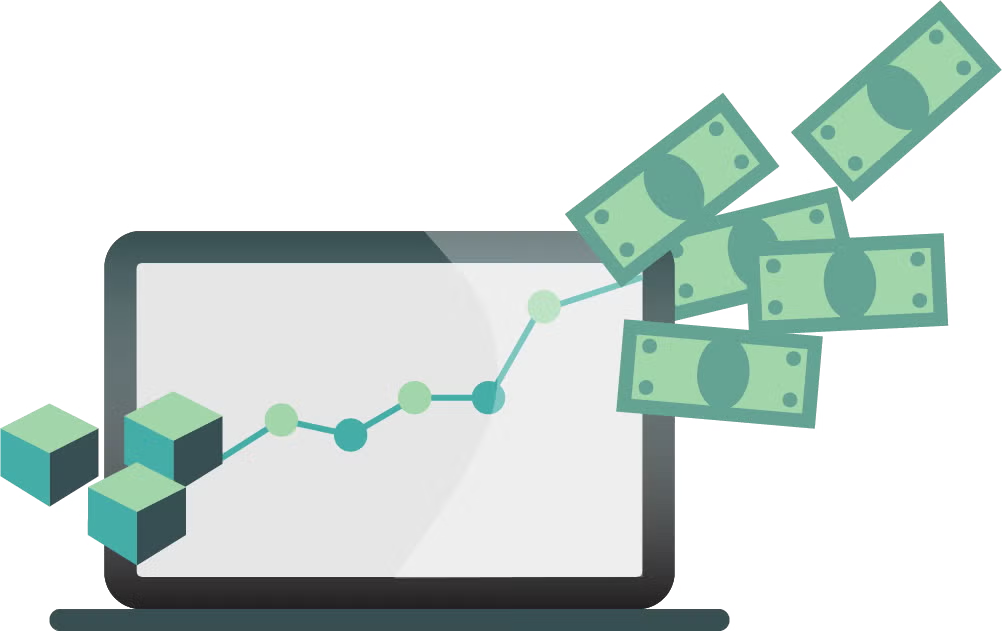
For example, your business may benefit from knowing how your “active user” count affects your AWS bill over time.
Make Logs Useful, Provide Context
Once you have all the pieces in place, users of your log analyzer will be able to visualize logs for their applications.
In some cases, they will be able to read logs for applications they didn’t write. Consider new hires; this tool will be useful only if they have enough context to understand it.

Infrastructure and programs vary among teams, but here’s a list of metadata that you might want to add to your logging:
- Services and API versions
- Source environment
- Docker instance ID
- Kubernetes cluster and pod ID
Additionally, you can ask developers to analyze logs for applications they don’t maintain. This process will provide feedback so that you know what elements are missing from your centralized logging implementation.
Logs are great at seeing problems you don’t know about ahead of time.
It’s better to store more context in an event than you need. Otherwise, by the time you need more information, the problem has already occurred.
This means you will need a code change to see more, which mean the problem lingers while you get the changes implemented and deployed.
Validate With All Your Test Methods
Whether it’s functional, load, unit, regression or any other form of testing, validate with your teams if they are getting valuable information from your log analyzer.
Each of these processes has different purposes; it’s reasonable to assume that some of their requirements escaped your initial assessment.
Keep this feedback loop open so your logging capacity stays in line with your codebase growth.
Decrease Noise, Allow Dynamic Tuning
Some developers maintain lists of “safe errors” in their application logs, a form of technical debt that adds unnecessary glut.
Maintaining a list of “errors you should ignore” is like hiding dust under the rug. There’s trash there, but you don’t want to put it away.
Encourage developers to remove safe error lists because each log line written, sent over the network, and stored somewhere is a cost.
Dynamic tuning is also a useful feature, as it allows you to change application log levels on the fly.
You don’t need abundant detail when things are going well, but debug logging is vital while troubleshooting issues that might vanish if you restart a failing service.
Enable Everyone to Log and View
One strategy to increase the usefulness of a log analyzer is to build sets of graphics directly related to your core business KPIs.
While logging is inherently technical, it holds valuable information for monitoring your costs and operating expenses. This sort of information can cause your manager to drool at the possibilities.
Whether your organization has grown under DevOps practices or you’re in a transition phase, visibility and transparency are principles you want to promote.
Try to introduce this tool as a means towards better software. You also need to discourage any effort to make it a source of blame; instead present it as an opportunity to look for improvements.
You may propose logging as a requirement that applications need to comply with before going live.
Provide development teams with specifications they need to meet earlier in their process. Enforce these specifications with automated testing in your delivery pipeline.
Define How Much Data History You Want
There are a handful of factors to consider when deciding how long you want to keep logs of your applications.
Legal requirements in certain industries and countries will force you to store logs for a minimum amount of time.
Hard disk space might be cheap these days, but storing all your logging in the same place for years will make your analysis process slow and more expensive.
Help your business define what it considers to be “old log data” and design an archiving strategy.
This could consist of compressing data or storing it in a cheaper storage tier. Document a process to recover this data when necessary and inform your users of how much time it’ll take to make this data available to them. All things considered, I would make sure not to lose granularity when archiving; you might lose valuable information that could be used as a baseline in the future.
All things considered, I would make sure not to lose granularity when archiving; you might lose valuable information that could be used as a baseline in the future.
Add Chaos Under Safe Conditions

At the time of writing, chaos engineering—introducing failure into your application infrastructure in a controlled way—is not yet a widespread trend.
Chaos engineering helps show developers how their code fails when an unexpected event destroys running instances.
If that sounds scary, implement it in a staging environment modeled to be as similar as possible to your live website. Validate if your log analyzer setup is useful for troubleshooting during induced and real service outages.
Log Analysis Is Never 100% Done
It’s important to create a continuous feedback loop that will help you keep your log strategy sharp as it grows and adapts to new services and metrics. Otherwise, your applications and features will grow and your log scope will be left behind.
There are many tools out there that can help you, based on your specific needs. If you are on Google Cloud, G Suite toolbox may be your choice. Perhaps you need easy to use filtering, then Loggly may be your log bookkeeper. If you need PCI compliance, Splunk can do you good.
No matter what you choose as log analyzer, strive to provide your organization with means to pinpoint their inefficiencies and make their work more efficient. Guide them to contribute their knowledge to your logging strategy, thus increasing the benefits they get from it.