|
|
OpenCensus is an open-source project started by Google that can emit metrics and traces when it integrates within application code to give you a better understanding of what happens when the application is running.
Debugging problems in a distributed system is not an easy task, especially when the application is running in production and not all of your customers are having problems. But as was once said on Twitter, if debugging is hard, it’s “probably because you aren’t instrumenting your code enough.”
Instrumentation is how your applications produce the events that will help you to have a better understanding of a problem when debugging in production. At debugging time, it’s too late to regret not including more debug code lines in the application.
That’s why you need to instrument your code with OpenCensus as soon as possible—so that when debugging time comes around, you’ll have everything you need.
Let’s take a look at what this project is, how it helps, and how you can start using it by exploring how it integrates within a Go HTTP service.

What Is OpenCensus?
OpenCensus is an open-source project that integrates within your application code.
Instead of having to manually write code to send traces and metrics on the application while it’s running, you use the OpenCensus libraries. These libraries exist in several programming languages, including Go, Java, C#, Node.js, C++, Ruby, Elixir, Python, Scala, and PHP. By using these libraries as frameworks, you can collect commonly used predefined data. You can find several getting started guides for each language in the official OpenCensus docs.
The data that OpenCensus collects is divided into two groups: metrics and traces.
Metrics are data points that tell you something about what’s happening in the application, such as the latency in a service call or user input.
Traces are the data that can show how the initial call propagates through the system; it’s like when you have to leave a trail to go deeper into the woods. Traces help you to find exactly where the application might be having problems.
Great, but how can you see the metrics and traces that OpenCensus collects? By using exporters.
Exporters are the mechanism that you use to send those metrics to other sources (also known as backends) like Prometheus, Zipkin, Stackdriver, Azure Monitor, and others. The idea behind exporters is that you can use all the data collected from the applications to analyze, debug, alert, or use any other function from the backend tool.
How Does OpenCensus Help You?
After you’re done instrumenting your application using OpenCensus, you won’t just get better at debugging your applications. You’ll also be able to understand new patterns, potential problems, or identify where exactly you can improve an application’s performance.
When I wrote about microservices logging best practices, my first advice was to tag each call with a unique ID. Having a unique identifier helps you to correlate all the events involved in each user call, creating a single context. A user will initiate the request to the first service. Then, you’ll need a tag or unique id to correlate all the following requests derived from the first request.

As simple as it sounds, it could become challenging to include this behavior in every service. By using OpenCensus you’ll be able to propagate the context of the request automatically.
Once you have the context, OpenCensus helps you expand it by adding traces. Each trace that OpenCensus generates will use the propagated context to help you to visualize the request’s flow in the system. Having traces allows you to know information like how much time each call took and where exactly the system needs to improve. From all the calls generated, you might identify that the user input has data that you didn’t consider and that’s what’s causing a delay in storing data in the cache.
Having as much information as you can, makes the process of reproducing the problem locally easier.
Getting Started With OpenCensus
Let’s get into the technical details of how OpenCensus helps you achieve everything I’ve been talking about so far. I’ll use a simple HTTP API written in Go where I added the instrumentation to generate metrics. Instead of inspecting servers or containers, I’ll use Prometheus to analyze the data.
You can find all the code that I’ll use and the file configurations in this Github repository: https://github.com/christianhxc/opencensus-golang-tutorial.
1. Pre-Requirements: Install and Configure
First things first, start by installing the following requirements to complete this guide:
- Docker, which will help you run the other tools we’ll use more easily.
- Go tools to build and run the sample application.
After installing Go, let’s get the OpenCensus libraries in your local environment. Run this command:
go get -u -v go.opencensus.io/...
Now you’ll be able to import the libraries for Prometheus, the OpenCensus HTTP wrapper utility, and the libraries needed to generate application metrics automatically.
2. Create an HTTP API With Go
Let’s create a simple HTTP API in Go—the next step will be to add the OpenCensus libraries. Create a main.go file with the following code:
package main

import (
	"log"
	"math/rand"
	"net/http"
	"strings"
	"time"
)

func main() {
	mux := http.NewServeMux()
	mux.HandleFunc("/list", list)
	log.Printf("Server listening! ...")
	log.Fatal(http.ListenAndServe(":8080", mux))
}

func list(w http.ResponseWriter, r *http.Request) {
	log.Printf("Serving request: %s", r.URL.Path)
	res := strings.Repeat("o", rand.Intn(99971)+1)
	time.Sleep(time.Duration(rand.Intn(977)+1) * time.Millisecond)
	w.Write([]byte("Hello, w" + res + "rld!"))
}
I’ve added a simple logic to the list function that will be exposed as a “/list” path in the API. What the list function does is print the “Hello, world!” text, but it will add a random number of o’s for the word “world.” Then, the function goes dormant for a random time to simulate a more realistic latency in the API endpoint.
To make sure it’s running, use the following command:
go run main.go
Access the API by opening in the browser the following URL: http://localhost:8080/list
$ go run src/main.go
2020/01/02 13:10:31 Server listening! ...
2020/01/02 13:10:42 Serving request: /list
2020/01/02 13:10:46 Serving request: /list
At this moment, the application is not sending any telemetry, so let’s change that.
3. Use the OpenCensus HTTP Handler
You can add the code to emit metrics in the application by using the stats library from OpenCensus, but it’s a little bit difficult. Since this is a getting started guide, I choose to instead use the HTTP handler from OpenCensus.
By using this library, it will emit a default set of metrics (i.e., latency, request body size, response body size, etc.) in every HTTP request.
You can skip this step if you decide to use the code from the Github repo.
Let’s start by adding the following libraries in the import section of the code:
"go.opencensus.io/exporter/prometheus"
"go.opencensus.io/plugin/ochttp"
"go.opencensus.io/stats/view"
Next, in the main function, include the code to use Prometheus as the exporter with a namespace called “golangsvc” that you’ll later use to run queries of the data:
pe, err := prometheus.NewExporter(prometheus.Options{
	Namespace: "golangsvc",
})
if err != nil {
	log.Fatalf("Failed to create Prometheus exporter: %v", err)
}
view.RegisterExporter(pe)
After exposing the list method, include the following code that will expose a metrics endpoint that Prometheus will use to gather data. Then add the code that will wrap every HTTP request and produce the telemetry.
mux.Handle("/metrics", pe)

h := &ochttp.Handler{Handler: mux}
if err := view.Register(ochttp.DefaultServerViews...); err != nil {
	log.Fatal("Failed to register ochttp.DefaultServerViews")
}
Finally, in the line where you initiate the HTTP listener, change the “mux” variable for the “h” variable we just created above. Like this:
log.Fatal(http.ListenAndServe(":8080", h))
I know, I know, just adding code portions might be confusing so here’s how the code should look like by now:
package main

import (
	"log"
	"math/rand"
	"net/http"
	"strings"
	"time"

	"go.opencensus.io/exporter/prometheus"
	"go.opencensus.io/plugin/ochttp"
	"go.opencensus.io/stats/view"
)

func main() {
	pe, err := prometheus.NewExporter(prometheus.Options{
		Namespace: "golangsvc",
	})
	if err != nil {
		log.Fatalf("Failed to create Prometheus exporter: %v", err)
	}
	view.RegisterExporter(pe)

	mux := http.NewServeMux()
	mux.HandleFunc("/list", list)

	mux.Handle("/metrics", pe)

	h := &ochttp.Handler{Handler: mux}
	if err := view.Register(ochttp.DefaultServerViews...); err != nil {
		log.Fatal("Failed to register ochttp.DefaultServerViews")
	}

	log.Printf("Server listening! ...")
	log.Fatal(http.ListenAndServe(":8080", h))
}

func list(w http.ResponseWriter, r *http.Request) {
	log.Printf("Serving request: %s", r.URL.Path)
	res := strings.Repeat("o", rand.Intn(99971)+1)
	time.Sleep(time.Duration(rand.Intn(977)+1) * time.Millisecond)
	w.Write([]byte("Hello, w" + res + "rld!"))
}
Initiate the application again with the “go run” command and refresh the browser. All you’re doing here is adding a wrapper, so the application should continue to work. We didn’t add any other logic to the response so to make sure that it’s sending the telemetry, let’s start a Prometheus instance.
4. Initiate Prometheus
Let’s start by creating the prometheus.yaml configuration to tell Prometheus to gather metrics from the API endpoint every four seconds. The content of the file should look like this:
global:
  scrape_interval: 5s
  external_labels:
    monitor: 'golangsvc'

scrape_configs:
  - job_name: 'golangsvc'
    scrape_interval: 4s
    static_configs:
      - targets: ['localhost:8080']
We’ll use Docker to initiate the Prometheus instance locally that will use the YAML file you just created attached to a volume. Run the following command; if you don’t have the Docker image it will start downloading it:
$ docker run --name prometheus --add-host="localhost:192.168.1.60" -d -p 9090:9090 -v ${PWD}/prometheus.yaml:/etc/prometheus/prometheus.yml prom/prometheus
Unable to find image 'prom/prometheus:latest' locally
latest: Pulling from prom/prometheus
57c14dd66db0: Pull complete
be921ee89692: Pull complete
fbb8756a459e: Pull complete
6aec8870acb9: Pull complete
7ebbe9635775: Pull complete
97f1ad242d03: Pull complete
36312887b954: Pull complete
f37e7f568e56: Pull complete
e07d138776c7: Pull complete
Digest: sha256:b32864cfe5f7f5d146820ddc6dcc5f78f40d8ab6d55e80decd5fc222b16344dc
Status: Downloaded newer image for prom/prometheus:latest
0f8ebe20cba01195400db1ab8d5c4a183efb8ec2b5338fdf494166988739fca3
Open the following URL in your browser: http://localhost:9090/graph and you should be seeing a screen like this one:
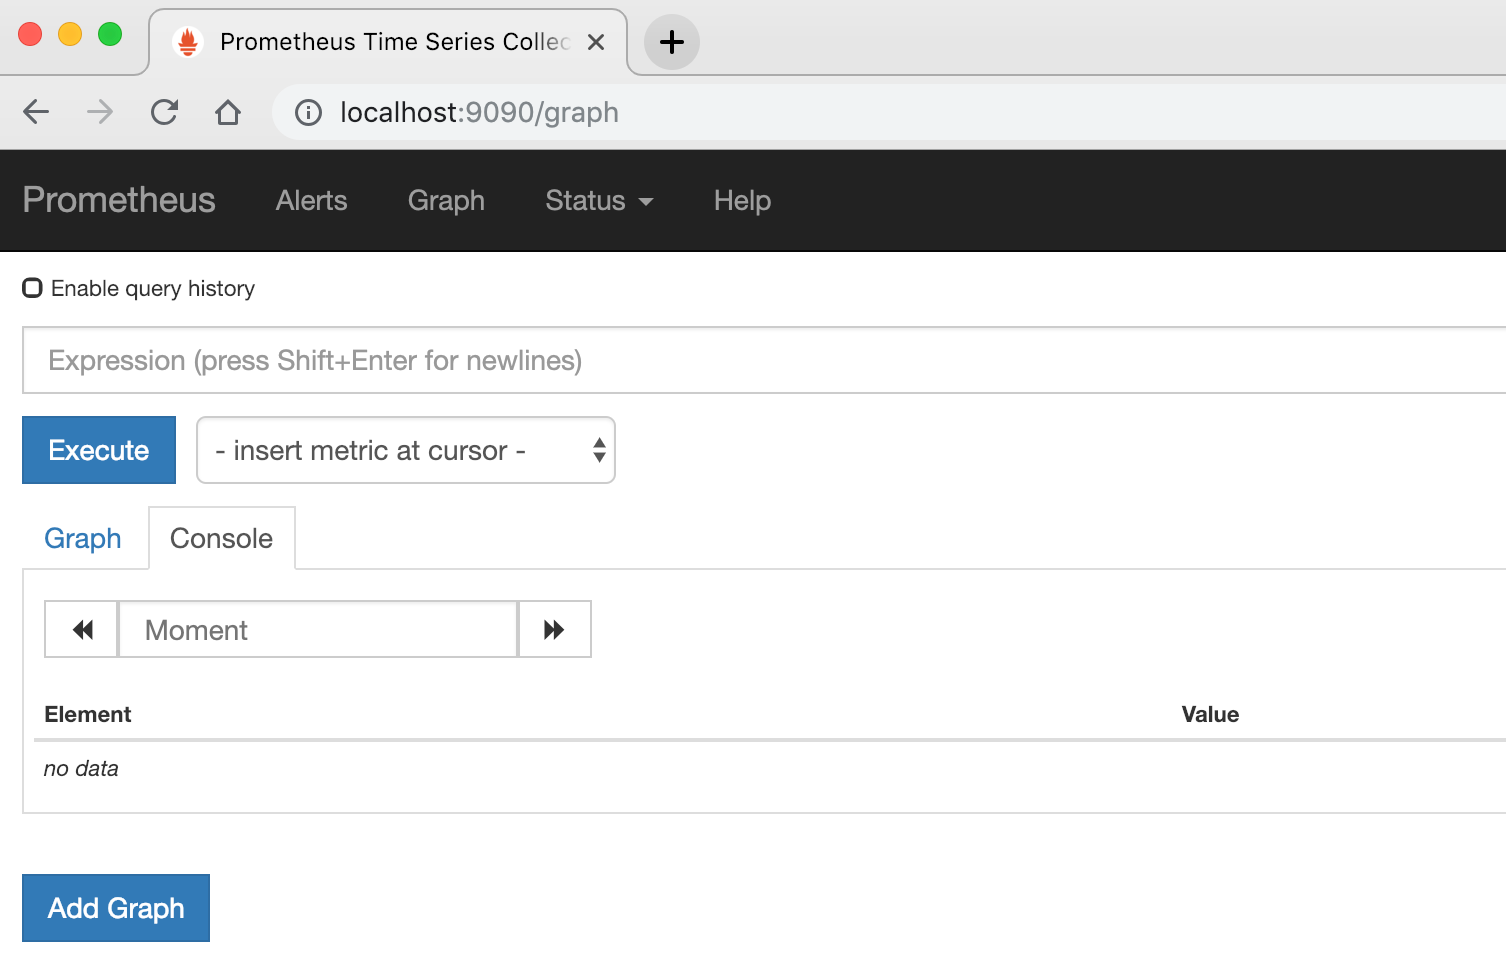
This screen is where we’ll query the data that the API will start generating.
5. Run the HTTP API
In case you haven’t done it when adding the new code, let’s run the HTTP API with the following command:
go run main.go
You should be able to see the new metrics endpoint that Prometheus will use to collect data. Open in the browser the following URL: http://localhost:8080/metrics and don’t worry if the screen is blank, data will appear after you test the HTTP API list path.
6. Generate Traffic Load to the HTTP API
Now let’s make things more interesting and send traffic to the application.
Let’s use Docker again, and this time we’ll use the ApacheBench (ab) tool to generate traffic. Run the following command, change the IP address “192.168.1.60” to your local internal IP, then leave the process running. In the meantime, you can get up and grab a cup of coffee. You can change the parameters to generate more or less traffic.
docker run --rm --add-host="localhost:192.168.1.60" jordi/ab -k -c 10 -n 5000 http://localhost:8080/list
The output should look like this:
$ docker run --rm --add-host="localhost:192.168.1.60" jordi/ab -k -c 10 -n 5000 http://localhost:8080/list
This is ApacheBench, Version 2.3 <$Revision: 1826891
gt; Copyright 1996 Adam Twiss, Zeus Technology Ltd, http://www.zeustech.net/ Licensed to The Apache Software Foundation, http://www.apache.org/ Benchmarking localhost (be patient)
When it ends, you’ll see something like this:
Connection Times (ms)
              min  mean[+/-sd] median   max
Connect:        0    1   2.1      1     133
Processing:     3  492 282.2    484    1685
Waiting:        2  489 282.3    480    1683
Total:          4  493 282.2    485    1687

Percentage of the requests served within a certain time (ms)
  50%    485
  66%    643
  75%    732
  80%    783
  90%    886
  95%    936
  98%    967
  99%    978
 100%   1687 (longest request)
Those metrics are OK, but let’s see what Prometheus collected.
7. Viewing Metrics With Prometheus
When you open the Prometheus URL again, you’ll see that the dropdown box to choose a metric will have more options, like this:
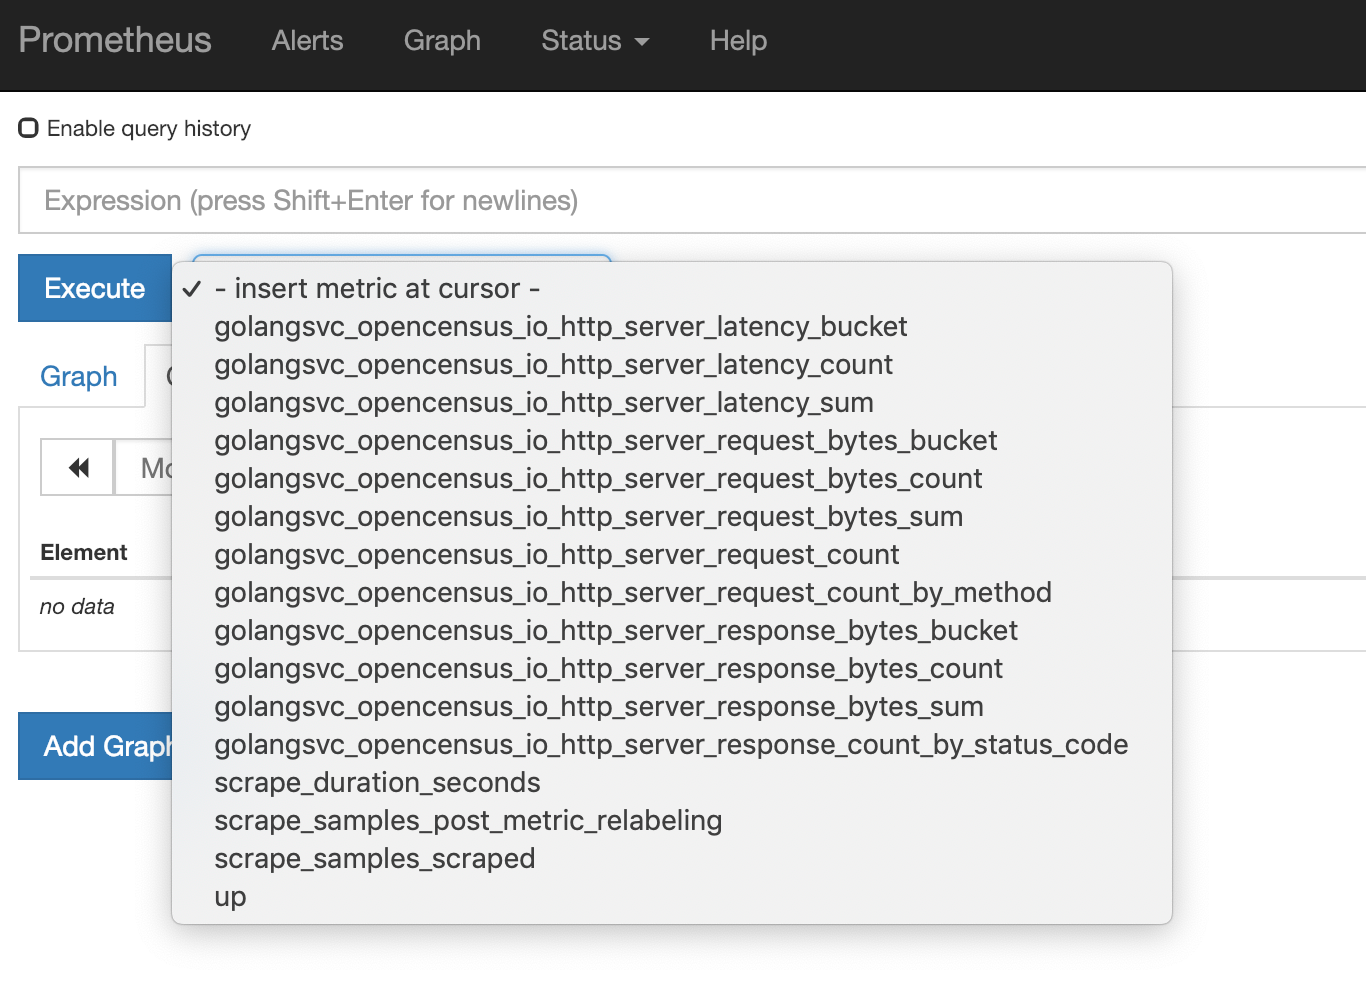
You can see that these are the default metrics that OpenCensus generates when using the HTTP wrapper.
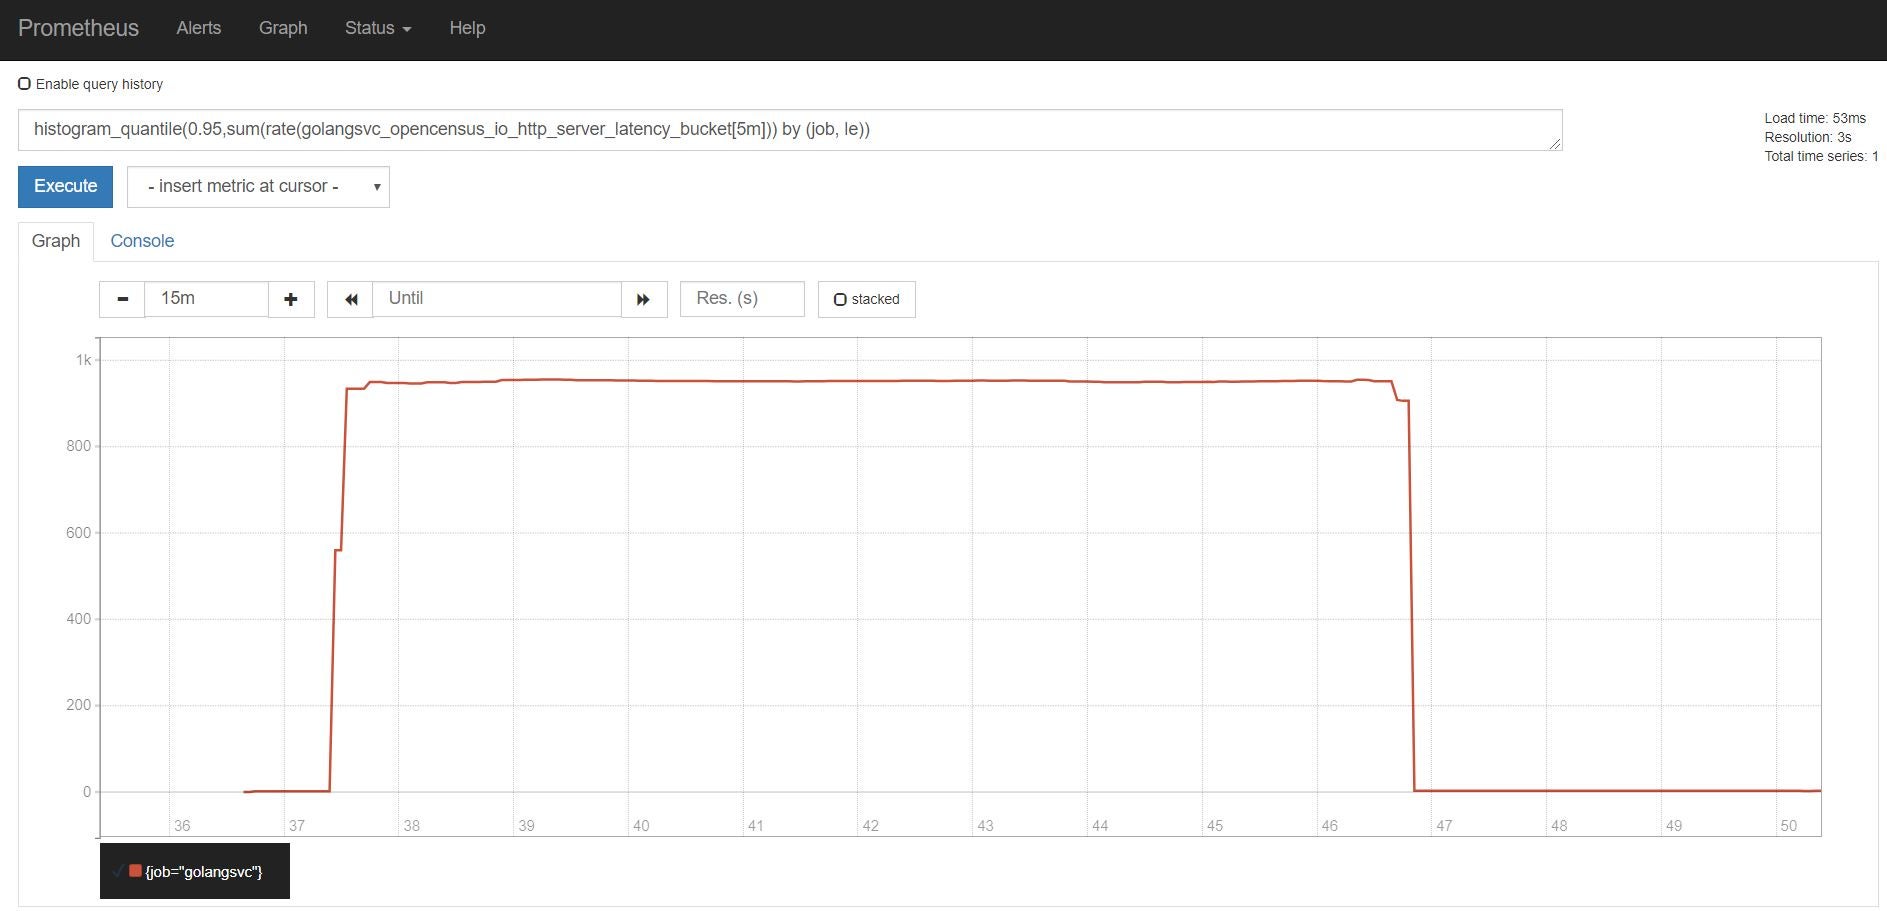
Let’s run a few queries to see how the application performed during the time that it was receiving traffic. Copy the following query expression into the “Expression” text box, then click on the blue “Execute” button.
histogram_quantile(0.95,sum(rate(golangsvc_opencensus_io_http_server_latency_bucket[5m])) by (job, le))
You’ll see in the graphic below a histogram of the latency numbers during the test period of the application.
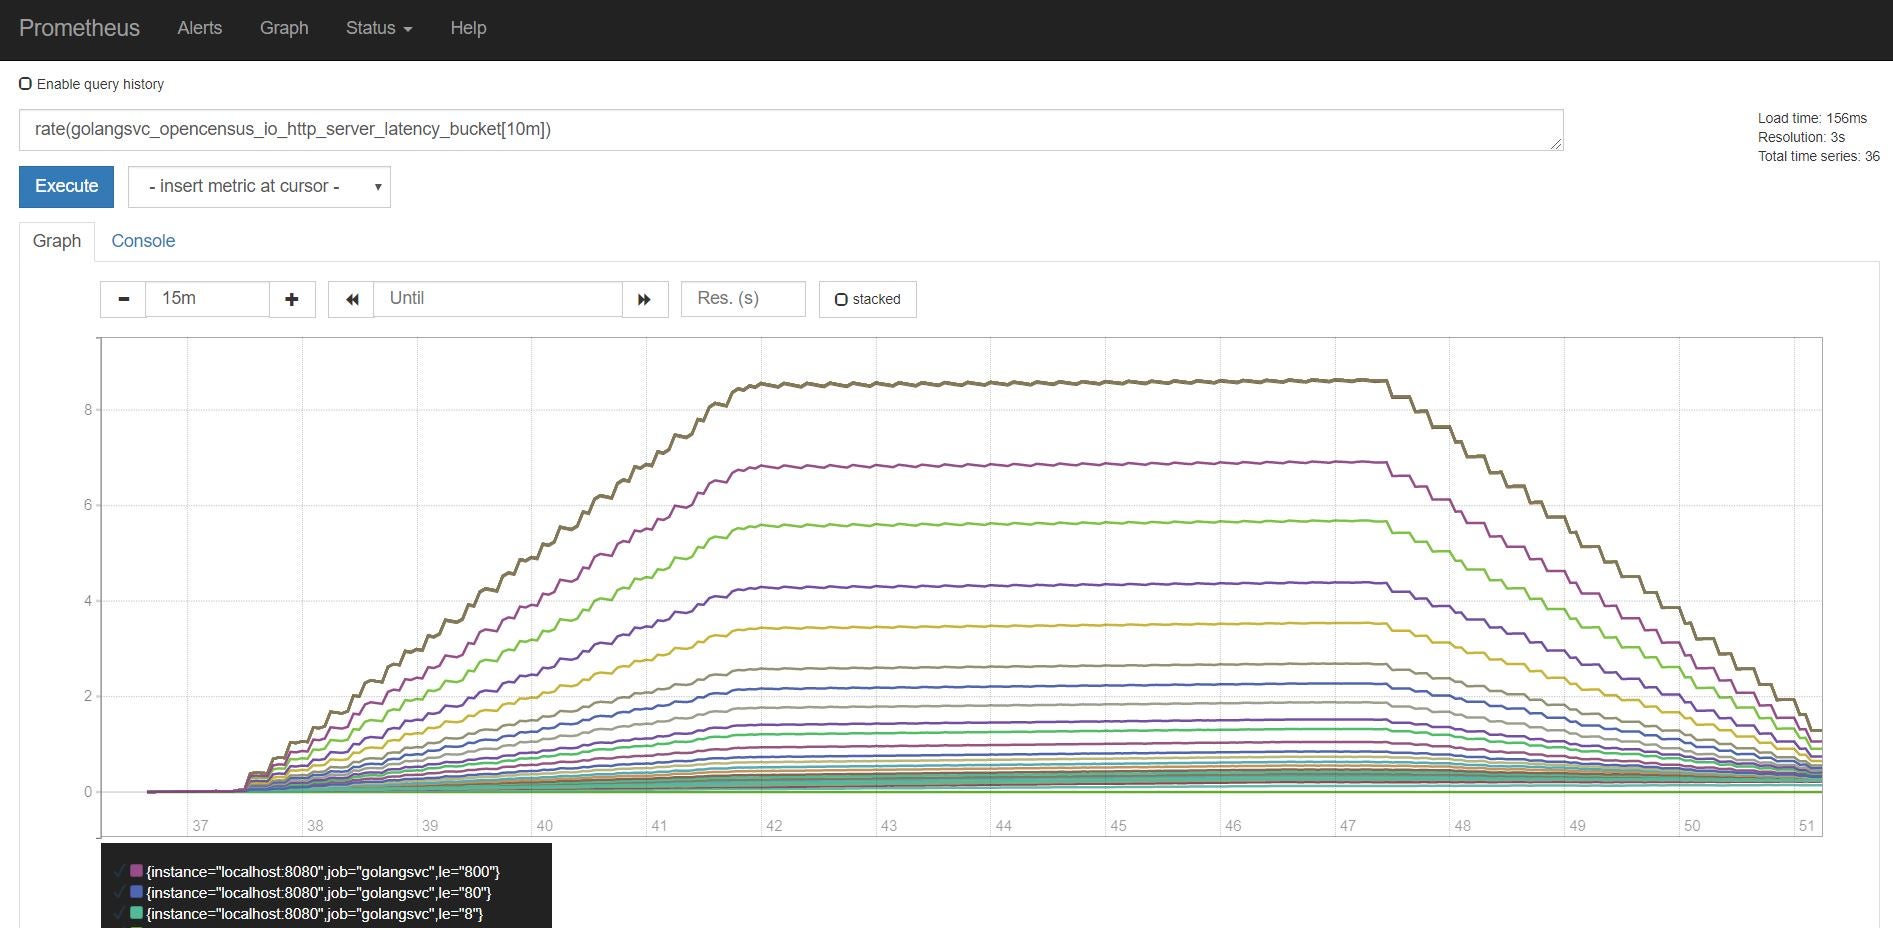
If you want to keep running other queries, you can use the following expressions. The following code will graph the latency rate grouped:
rate(golangsvc_opencensus_io_http_server_latency_bucket[10m])
And this one will graph the request bytes:
rate(golangsvc_opencensus_io_http_server_request_bytes_bucket[10m])
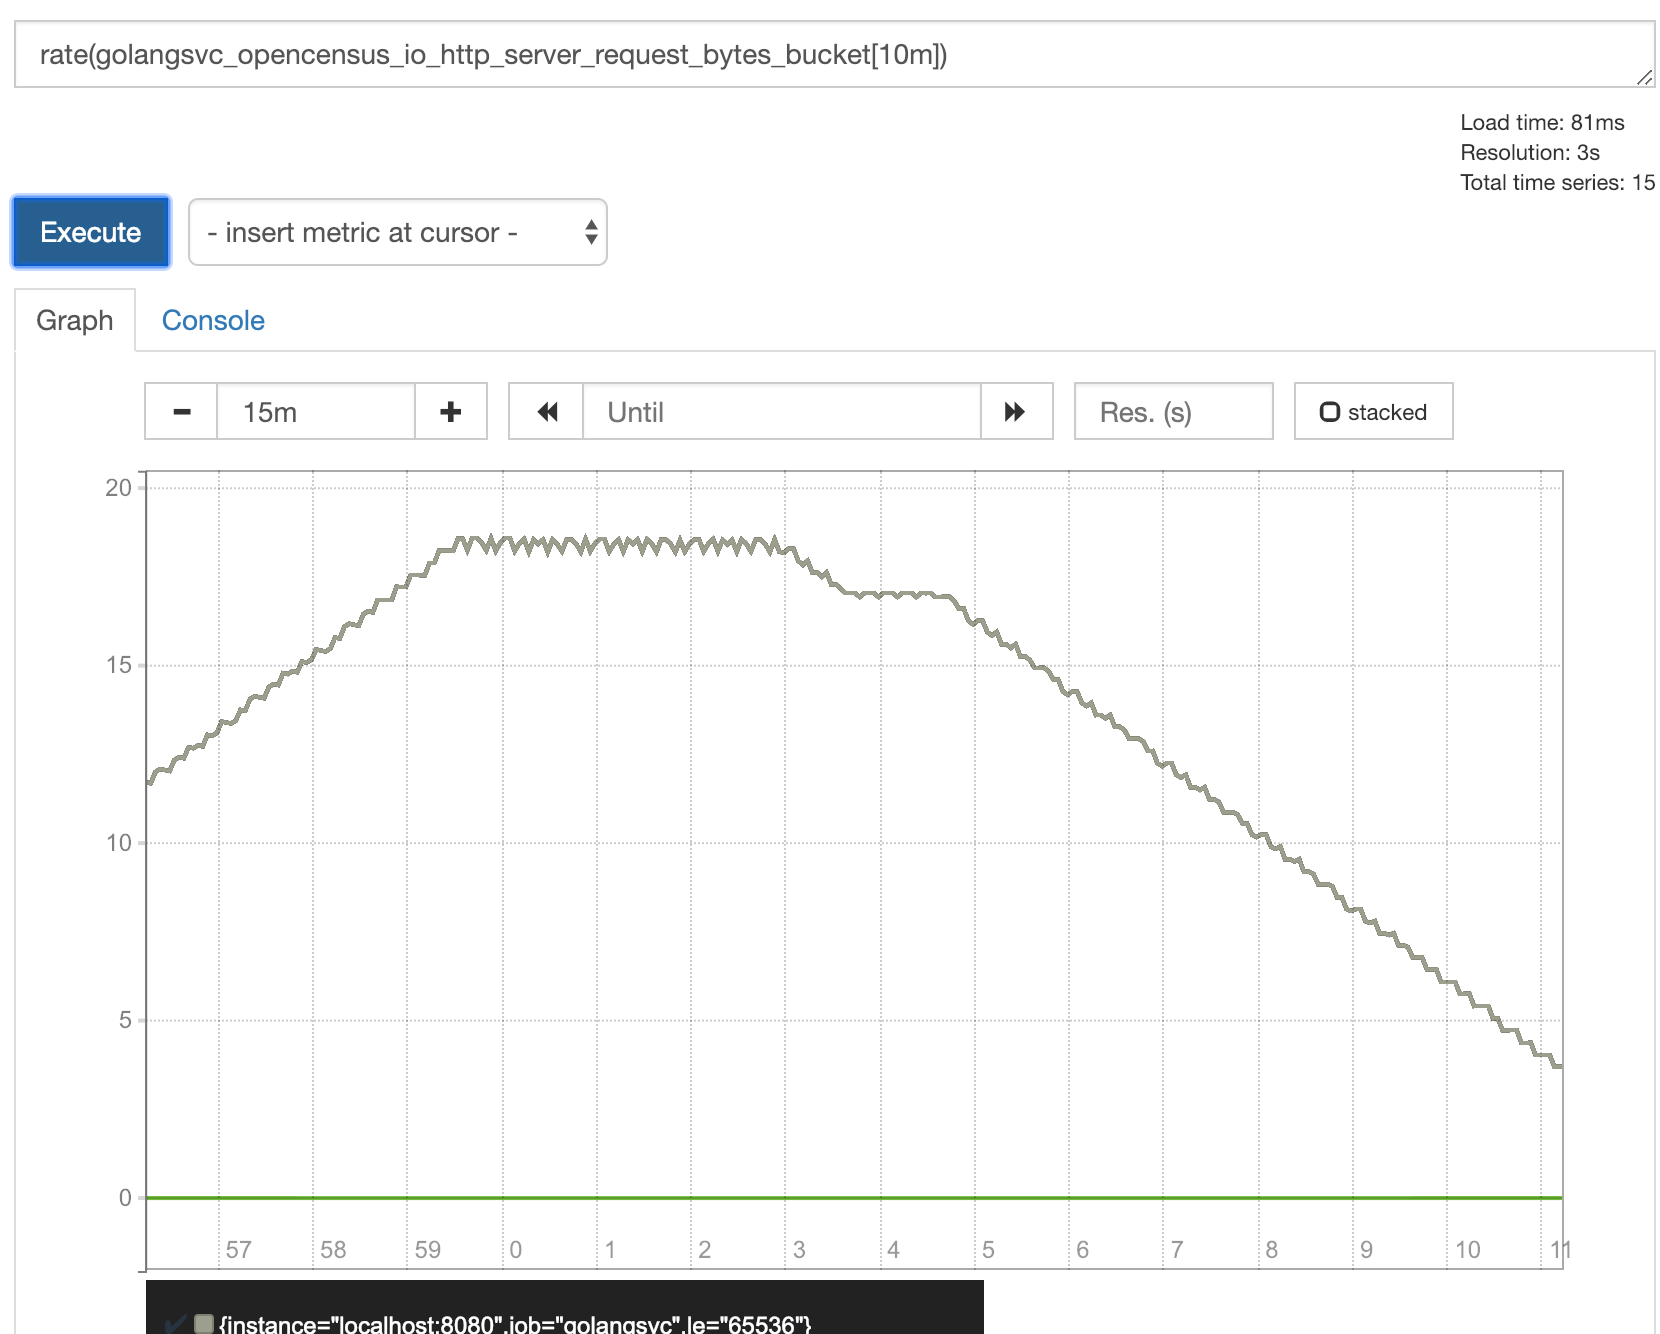
And that’s it! You can continue adding metrics manually or configure which metrics to emit when using the wrapper.
Add Instrumentation With OpenCensus
OpenCensus helps you to add instrumentation to the application code so that when you need to debug the system in production, you’ll hopefully have all the data you need. If when debugging systems you find yourself in the position of wishing you had more data to understand what’s happening, you have more problems. Avoid being in that position by adding as much data as possible.
What I really like about OpenCensus is that you can send data to more than one backend at the same time. If you find out that the tool you’re using to analyze logs is too basic, then change it. When using OpenCensus you don’t have to change too many lines of code to use another backend.
Monitoring Applications
Logs are a rich source of information. When building applications, you have to implement proper logging. When you have logs coming in from your application, you can analyze application metrics easily. Along with that, logs can also help you identify parts of the application that are causing problems. What use are logs of you can’t use them? Opencensus is helpful in collecting metrics and traces. But you need more than that, a complete package. Logs can be messy if you don’t handle them properly. And an application could be generating tons of logs. You should focus more on how to make use of logs than how to collect, parse logs, and visualize log data. And Scalyr takes care of that part for you.
Scalyr has got everything you need for application monitoring and troubleshooting. Scalyr provides rich dashboards, alerts, notifications, and much more. You can easily instrument your applications to send logs to a local log file, install Scalyr´s agent, and see metrics and traces in Scalyr’s platform. You can give it a try to see by yourself what possibilities you have once you have metrics and traces available.