|
|
Whenever I looked up for monitoring system on the internet, Prometheus is something that frequently came up. After a point, I was like “Alright, I’ve been seeing this too much. Let’s give it a try!”. So, I started using Prometheus. I did the basic installation and configuring but I didn’t find it as impressive as much as I was reading about it on the internet. Soon, I realized that I wasn’t using Prometheus to its utmost potential.
Once you’ve been able to install, configure, and run sample queries to explore metrics in Prometheus, the next step is to learn how to get the most of it.
Perhaps you’re just evaluating whether Prometheus works for your use case. For new users like me when I started, it could be confusing what to do next. For instance, which metrics are available? How do you see the metrics from servers or applications? Is it possible to see logs? In this post, I’ll answer these questions and share some other things you can learn to get the most out of Prometheus.
So, here are five things you can learn to have a better idea of how to use Prometheus.
1. Core Metric Types Available
One of the first things you need to know is that metrics have a unique name with a raw value at the time it was collected. For instance, a metric with the name “go_gc_duration_seconds” will tell the GC (garbage collector) duration of each invocation from a Go application (in this case, Prometheus is the application). But for certain metrics, you’ll also have a type like “count” or “sum,” as seen in the graphic below (notice the suffixes):
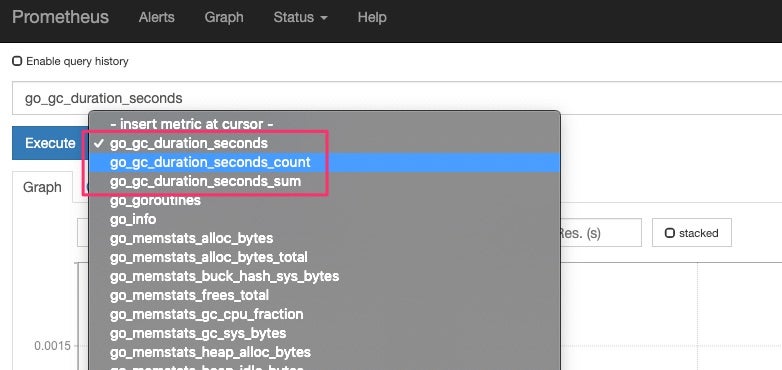
At this moment, for Prometheus, all metrics are time-series data. The Prometheus client libraries are the ones in charge of aggregating metrics data, like count or sum. Usually, these client libraries—like the Go library from the graphic above—have four types of metrics: counter, gauge, history, and summary. Let me briefly explain them:
- Counter is for cumulative values, like the number of requests or errors.
- Gauge is to represent a single value that can go up or down, like CPU usage.
- Histogram is used to track the size of an event, like a request time, and will group values in custom quantiles (buckets) depending on the data.
- Summary is similar to a histogram, but the difference is that the quantiles don’t depend on the data (typically, you’ll have 0.5, 0.9, or 0.99 quantiles).
I’d advise you to always take a look at the client library docs to understand what metric types they can generate when you use them. Also, read Prometheus docs on best practices for histograms and summaries.
2. Direct Instrumentation With Client Libraries
At this moment, I’ve talked about some of the default metrics you’ll get with a fresh Prometheus installation. The first metrics you’ll be able to explore will be about the Prometheus instance you’re using. Therefore, if you want to have more metrics in Prometheus, you have to instrument your applications to do so—this process is called “direct instrumentation.” And here’s where the client libraries come in.
Prometheus has a list of official libraries for languages like Go or Java. But there are also third-party libraries that cover pretty much all the popular programming languages.
The benefit of using these libraries is that in your code, you only have to add a few lines of code to start emitting metrics. You don’t have to worry about Prometheus’ text format or how to expose the “metrics” endpoint correctly (more on this later). These libraries will help you get started quickly. Moreover, you’ll get some default metrics out of the box, like CPU usage.

In case you want to see some code, here’s the “Hello, World!” for instrumenting a Go application:
package main

import (
        "net/http"
        "time"

        "github.com/prometheus/client_golang/prometheus"
        "github.com/prometheus/client_golang/prometheus/promauto"
        "github.com/prometheus/client_golang/prometheus/promhttp"
)

func recordMetrics() {
        go func() {
                for {
                        opsProcessed.Inc()
                        time.Sleep(2 * time.Second)
                }
        }()
}

var (
        opsProcessed = promauto.NewCounter(prometheus.CounterOpts{
                Name: "myapp_processed_ops_total",
                Help: "The total number of processed events",
        })
)

func main() {
        recordMetrics()

        http.Handle("/metrics", promhttp.Handler())
        http.ListenAndServe(":2112", nil)
}
3. Indirect Instrumentation With Exporters
There might be other applications or systems that you don’t own and therefore can’t instrument to emit metrics—for instance, an NGINX server. As long as there are some logs you can read—like the error and access logs provided by NGINX—you’re good. In these scenarios, you need what Prometheus calls “exporters.”
An exporter is a tool that you deploy with your applications or systems. Exporters act as a proxy between your systems and Prometheus. Prometheus will ask this proxy for metrics, and this tool will take care of processing data, transform it, and return it to Prometheus—this process is called “indirect instrumentation.”
There are tons of exporters, and each one is configured differently. For example, there’s a node exporter that you could install in a Linux machine and start emitting OS metrics for consumption by Prometheus. Windows has support as well. And continuing with the NGINX example, you could install an exporter for NGINX written in Lua and then have an nginx.conf file like this:
server {
  listen 9145;
  allow 192.168.0.0/16;
  deny all;
  location /metrics {
    content_by_lua '
      metric_connections:set(ngx.var.connections_reading, {"reading"})
      metric_connections:set(ngx.var.connections_waiting, {"waiting"})
      metric_connections:set(ngx.var.connections_writing, {"writing"})
      prometheus:collect()
    ';
  }
4. Prometheus Is Suitable for Metrics Only
One thing that’s essential to keep in mind is that Prometheus is a tool for collecting and exploring metrics only. This is because Prometheus works with a data model with time series, in which data is identified by a metric name and contains key/value pairs.
In other words, you can’t use Prometheus for logging or event-driven architectures in which you must track individual events. Notice that none of the examples or use cases I’ve used in previous sections are for logs. Prometheus is suitable for storing CPU usage, latency requests, error rates, or networking bandwidth.
Another essential feature from Prometheus is that it makes trade-offs with the data it collects. This means that it will prefer to offer data that is 99.99% correct (per their docs) instead of breaking the monitoring system or degrading performance. So, expect to lose some data, and don’t use it for critical information like bank account balances.

5. Prometheus Is a Pull-Based Metrics System
From the code and configuration examples I used in the previous section, you may have noticed that we need to expose a “/metrics” endpoint. Client libraries, or exporters, don’t send metrics directly to Prometheus.
Instead, what they do is to expose an endpoint that returns a payload with all the metrics available in the Prometheus format. Every certain amount of time—say, five minutes—Prometheus will consume this endpoint to collect data. This endpoint has to return a payload in a format that Prometheus can understand.
So, Prometheus pulls (or “scrapes”) metrics whenever it needs. This is what’s called a “pull-based system,” and it’s a good approach when you have to monitor a lot of servers and applications. You’d prefer to have data arriving late, rather than to lose data.
Prometheus has a blog post that talks about the challenges, benefits, and downsides of both pull and push systems. I’m not trying to go more in-depth on this subject. What I want you to know is that the preferred way of working with Prometheus is by exposing an endpoint that emits metrics in a specific format. It doesn’t mean that Prometheus can’t work with a push-based approach. But you should choose this approach only when it’s necessary.
Numeric Time-Series Monitoring
Today I focused on the metrics side of Prometheus. Once you have data arriving at the tool, you’ll need to start analyzing it, creating graphs, and creating alerts. Otherwise, metrics alone won’t be too beneficial.
Prometheus is a simple tool, as reflected by UI. And once you understand the basics of how and why it works the way it works, the rest will be evident. For me, in the beginning, I was treating Prometheus as a push-based system and thought that it was only useful for Kubernetes. But as this post shows, Prometheus can collect metrics from a variety of sources.
With the help of client libraries, you don’t have to code each integration anymore. The benefit here is that you don’t have to worry about Prometheus text format. Prometheus text format became a standard a couple of years ago. But it is not a global standard. A team of engineers is working on developing a neutral standard that would be relevant for all the vendors. This is known as the OpenMetrics Project.
So, that’s it! Remember that Prometheus is a numeric time-series monitoring tool—and that metrics won’t arrive from heaving or by using a magic trick. You need to instrument your systems properly. If you’d like to go deeper with Prometheus, I’d recommend you read the book Prometheus Up & Running by Brian Brazil.
If you are someone who’s been using Prometheus and want to get your system monitoring to the next level, I suggest you give Scalyr a try. Scalyr is a log management tool that makes it easy for you to collect logs and process them into a meaningful format. You can get Scalyr for a free trial here.