|
|
Prometheus has become the most popular tool for monitoring Kubernetes workloads. Even though the Kubernetes ecosystem grows more each day, there are certain tools for specific problems that the community keeps using. Prometheus is one of them. The gap Prometheus fills is for monitoring and alerting.
Today’s post is an introductory Prometheus tutorial. You’ll learn how to instrument a Go application, spin up a Prometheus instance locally, and explore some metrics. I’ve always thought that the best way to learn something new in tech is by getting hands-on.
But before we get started, let’s get to know the tool so that you don’t simply follow a recipe.

What Is Prometheus?
First things first, Prometheus is the second project that graduates, after Kubernetes, from the Cloud Native Computing Foundation (CNCF). Not many projects have been able to graduate yet. Having a graduated monitoring project confirms how crucial it is to have monitoring and alerting in place, especially for distributed systems—which are pretty often the norm in Kubernetes.
Now, let’s talk about Prometheus from a more technical standpoint. Prometheus pulls metrics (key/value) and stores the data as time-series, allowing users to query data and alert in a real-time fashion. At given intervals, Prometheus will hit targets to collect metrics, aggregate data, show data, or even alert if some thresholds are met—in spite of not having the most beautiful GUI in the world.
How Does Prometheus Integrate With Your Workloads?
Because Prometheus works by pulling metrics (or scrapping metrics, as they call it), you have to instrument your applications properly.
Officially, Prometheus has client libraries for applications written in Go, Java, Ruby, and Python. Other languages like C#, Node.js, or Rust have support as well, but they’re not official (yet). And for those short-lived applications like batch jobs, Prometheus can push metrics with a PushGateway. But keep in mind that the preferable way to collect data is to pull metrics from an application’s endpoint.
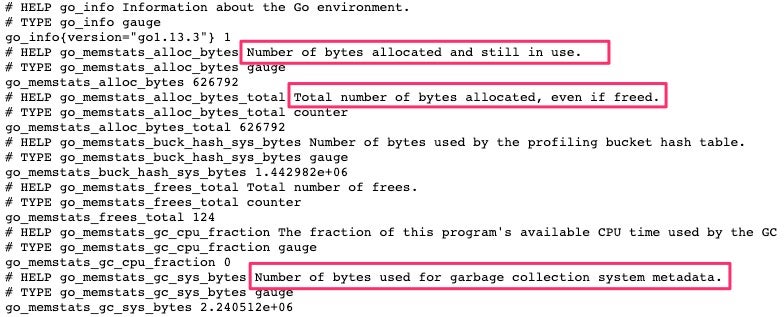
When using client libraries, you get a lot of default metrics from your application. For example, in Go, you get the number of bytes allocated, number of bytes used by the GC, and a lot more. See the below screenshot:
You can emit custom metrics—such as latency, requests, bytes sent, or bytes received—as well, if needed. But you have to be aware that this type of data might get lost if the application crash or restarts. To reduce the risk of losing data, you need to configure an appropriate window in Prometheus to regularly pull metrics. For example, you might configure Prometheus to do this every thirty seconds.
You can find more details in Prometheus documentation regarding how they recommend instrumenting your applications properly.
OK, enough words. It’s time to play with Prometheus.
Roll Up Your Sleeves; Let’s Get Hands-On
One of the easiest and cleanest ways you can play with Prometheus is by using Docker. So to follow along with this Prometheus tutorial, I’m expecting that you have at least Docker installed. Moreover, I have everything in GitHub if you just want to run the commands.

1. Instrument an Application
To start, I’m going to use an existing sample application from the client library in Go. It only emits random latency metrics while the application is running. I’m not going to explain every section of the code, but only a few sections that I think are crucial to understanding how to instrument an application.
Let’s explore the code from the bottom to the top. At the bottom of the main.go file, the application is exposing a /metrics endpoint. This is the endpoint that prints metrics in a Prometheus format, and it uses the promhttp library for that.
http.Handle("/metrics", promhttp.Handler())
If you scroll up a little bit, you’ll see that the following code is the one in charge of emitting metrics while the application is running in an infinite loop:
go func() {
	for {
		v := (rand.NormFloat64() * *normDomain) + *normMean
		rpcDurations.WithLabelValues("normal").Observe(v)
		rpcDurationsHistogram.Observe(v)
		time.Sleep(time.Duration(75*oscillationFactor()) * time.Millisecond)
	}
}()
The above code is calling two variables from the top that includes the name of the metric and some specific details for the metric format like distribution groups.
And look at the following code. This is how you’d set the name of the metric and some useful description for the metric you’re tracking:
rpcDurations = prometheus.NewSummaryVec(
	prometheus.SummaryOpts{
		Name:       "rpc_durations_seconds",
		Help:       "RPC latency distributions.",
		Objectives: map[float64]float64{0.5: 0.05, 0.9: 0.01, 0.99: 0.001},
	},
	[]string{"service"},
)
2. Compile and Run
Now, let’s compile (make sure the environment variable GOPATH is valid) and run the application with the following commands:
go get -d
go build
./random -listen-address=:8080
Or, if you’re using Docker, run the following command:
docker run --rm -it -p 8080:8080 christianhxc/gorandom:1.0
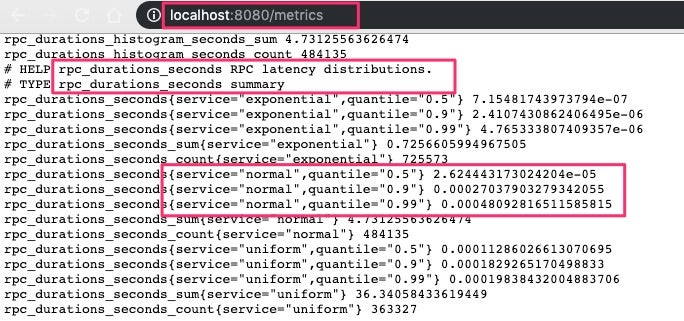
Open a new browser window and make sure that the http://localhost:8080/metrics endpoint works. You’ll be able to see the custom metrics:
3. Install Prometheus
One way to install Prometheus is by downloading the binaries for your OS and run the executable to start the application. Or, you can use Docker with the following command:
docker run --rm -it -p 9090:9090 prom/prometheus
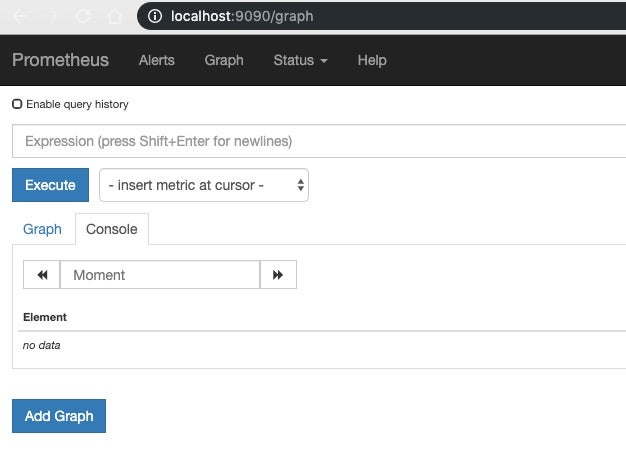
Open a new browser window, and confirm that the application is running under http:localhost:9090:
4. Configure Prometheus
At this time, we’re using Prometheus with a default configuration. But we need to tell Prometheus to pull metrics from the /metrics endpoint from the Go application. To do that, let’s create a prometheus.yml file with the following content. (Make sure to replace 192.168.1.61 with your application IP—don’t use localhost if using Docker.)
global:
  scrape_interval:     15s # By default, scrape targets every 15 seconds.
  evaluation_interval: 15s # Evaluate rules every 15 seconds.

  # Attach these extra labels to all timeseries collected by this Prometheus instance.
  external_labels:
    monitor: 'scalyr-blog'

rule_files:
  - 'prometheus.rules.yml'

scrape_configs:
  - job_name: 'prometheus'

    # Override the global default and scrape targets from this job every 5 seconds.
    scrape_interval: 5s

    static_configs:
      - targets: ['localhost:9090']

  - job_name:       'golang-random'

    # Override the global default and scrape targets from this job every 5 seconds.
    scrape_interval: 5s

    static_configs:
      - targets: ['192.168.1.61:8080']
        labels:
          group: 'production'
It’s the last section that’s telling Prometheus to pull metrics from the application every five seconds and tag the data with a group label with a production value. You can configure other endpoints, and add the tags you need.
Terminate the command you used to start Prometheus, and use the following command that includes the use of the local prometheus.yml file:
docker run --rm -it -p 9090:9090 -v $(pwd)prometheus.yml:/etc/prometheus/prometheus.yml prom/prometheus
Refresh or open a new browser window to confirm that Prometheus is still running.
5. Explore Metrics in Prometheus UI
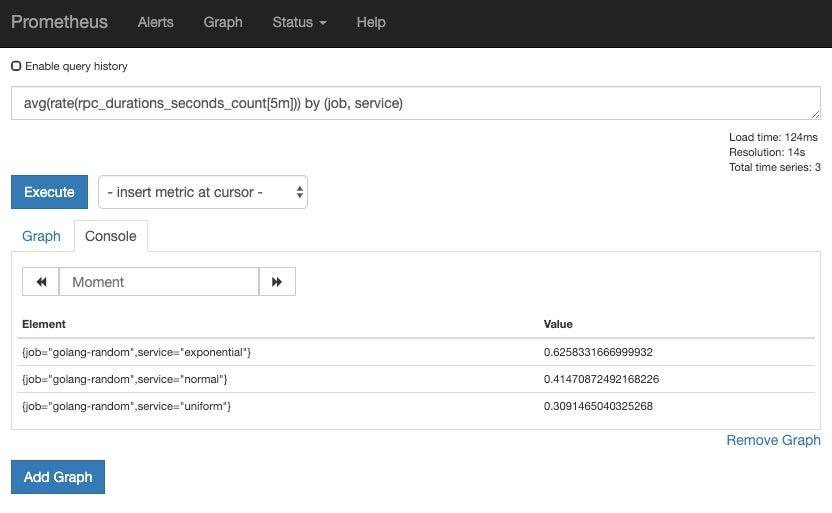
Use the following expression in the Expression textbox to get some data for a window of five minutes:
avg(rate(rpc_durations_seconds_count[5m])) by (job, service)
Click on the blue Execute button, and you should see some data:
Click on the Graph tab to see a graphic for the same data from the query:
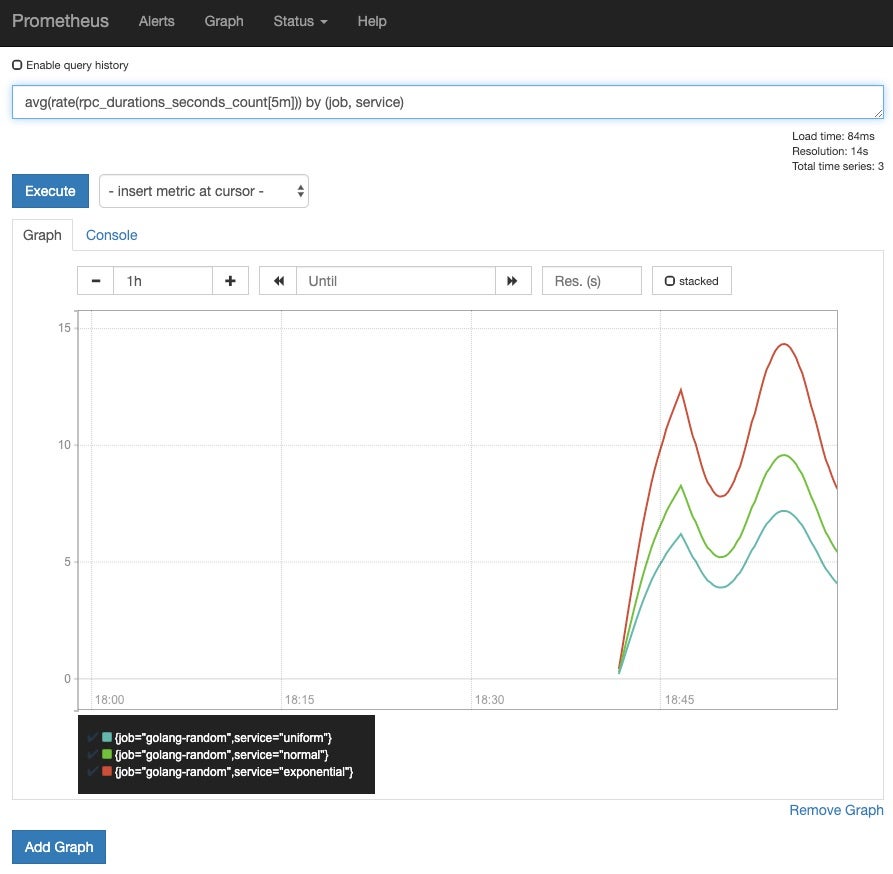
And that’s it! That’s the “Hello World” use case for Prometheus.
Once you’re collecting data, you can set alerts, or configure jobs to aggregate data. There’s going to be a point where you’ll have lots of data, and the queries you run will take more time to return data. And you can include aggregation rules as part of the Prometheus initial configuration.

Metrics, Metrics, Metrics
Getting started with Prometheus is not a complex task, but you need to understand how it works and what type of data you can use to monitor and alert.
What I included here is a simple use case; you can do more with Prometheus.
For example, you can configure alerts using external services like Pagerduy. Or you can receive metrics from short-lived applications like batch jobs. But keep in mind that Prometheus focuses only on one of the critical pillars of observability: metrics. You’ll need to use other tools for the rest of the pillars like Jaeger for traces.
Prometheus is a good fit for collecting metrics from servers or distributed systems like microservices. You can diagnose problems by querying data or creating graphs. And that means you’ll get a better understanding of your workloads’ health.