|
|
Originally posted on Medium
What is RED?
RED started with WeaveWorks as an off-shoot of Google’s Golden Signals. Originally focused on microservices architectures, RED offers substantial benefits to any transaction-based service (which means most of the Cloud Native world). It’s clean and easily understandable and provides a clear, consistent picture to any service. In short, not just microservices but any service-based, function-based or transaction-based domain will benefit from RED monitoring
However, RED does not fit into batch-oriented applications nor streaming applications. Since its focus is on the application/service transaction, it’s not the right tool for infrastructure monitoring. And even though RED doesn’t include the S (Saturation) of Golden Signals, feel free to add it back in if you like.
So RED starts with multiple dimensions for critical awareness across a spread of services. Such services can be individual (watch out for data overload) or groups. Today, the need is to reduce mean time to recognition and mean time to resolution. Just having a clue as to whether something is performing as expected or that something is out of range may aid in recognition, but likely is not enough to get you to resolution.
So we need to add another dimension.
With RED, unlike many modern expressions in observability, your architecture is watched from aspects of multiple dimensions. You aren’t limited to the narrow overview created by pure metrics. You receive alerts and indications not just from anomalies, but also receive notifications from headache alerts. Further, By seeing these multiple dimensions, be they failures in service or activity to close to the edge of capability, they combined monitoring and deep-dives, providing focused access get you to your root cause faster, with less false positives and quicker resolution.
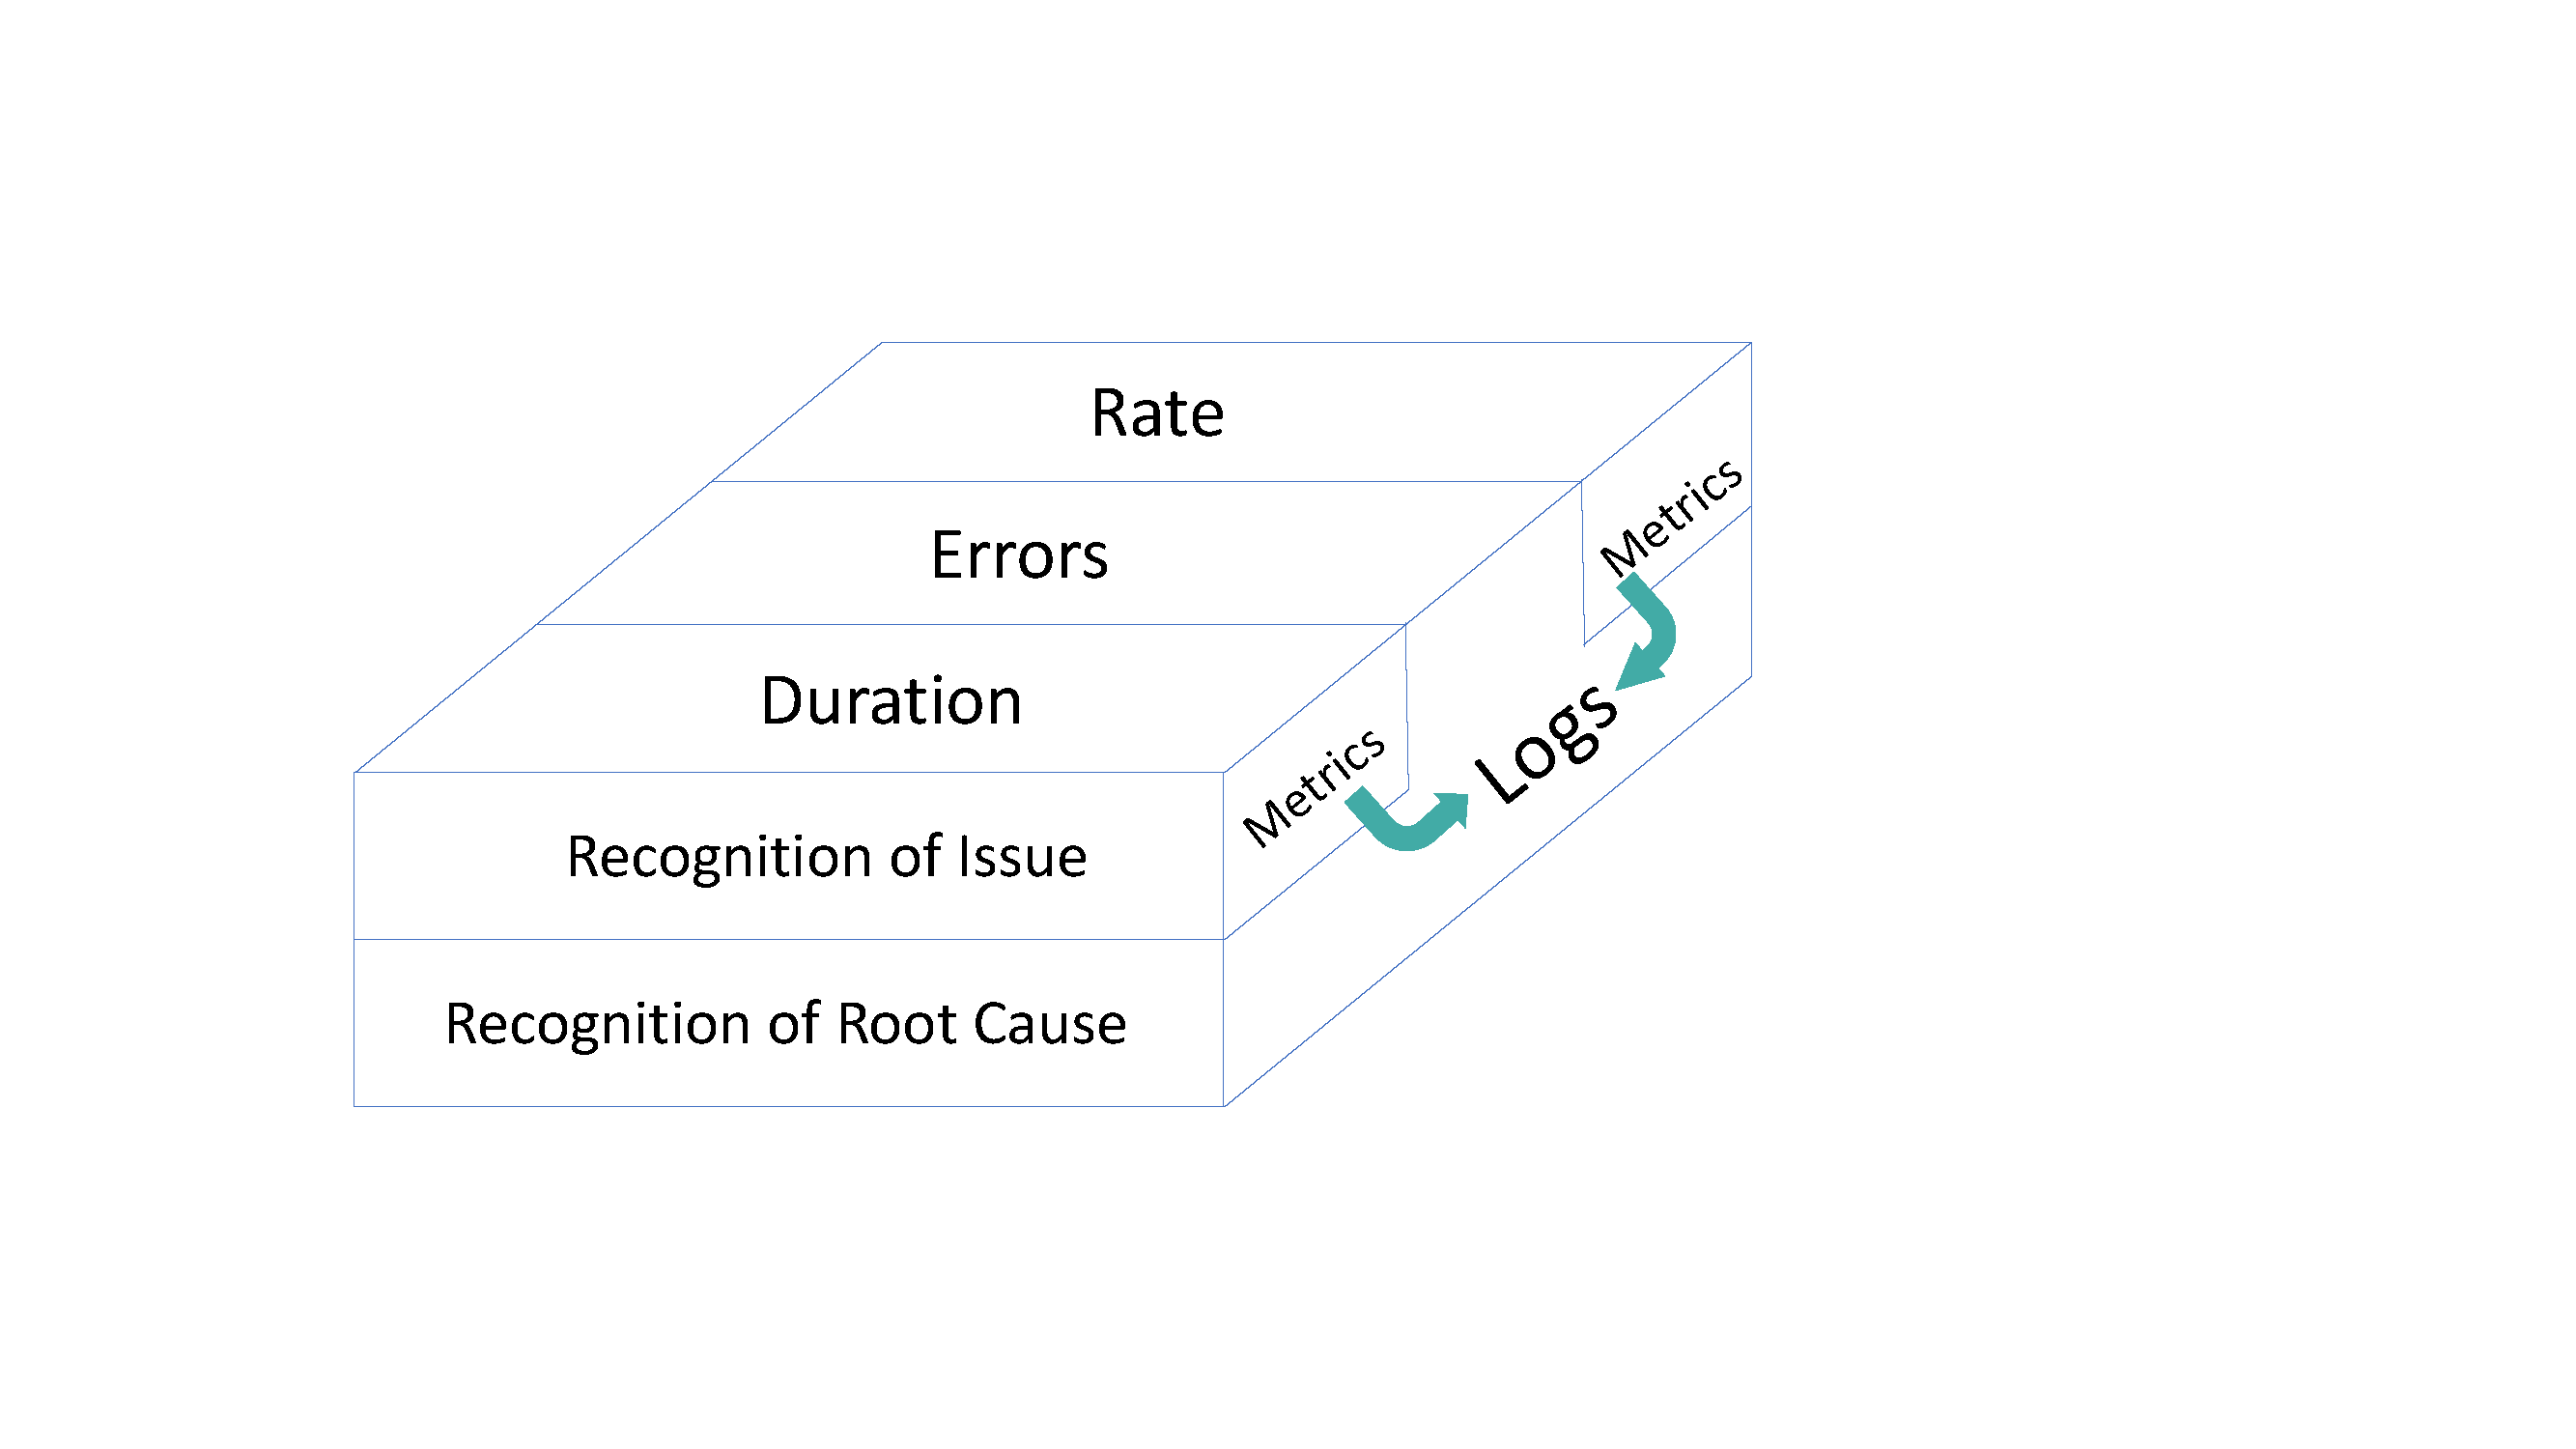
Let’s take a look at the items that make you see RED.
Rate, or traffic, can be considered as the number of requests on the network and system. Think of this as bandwidth and to quote John Mashey, “Bandwidth costs money”. Are you hitting peak loads that exceed your bandwidth? This is the communication pipeline for your apps and your enemy is peak load.
Rate includes monitoring of lots of items. High-level ones are like HTTP, SOAP, REST. But keep in mind that it’s not just the web, it’s things like middleware messaging/queuing, API calls. It can also be overhead of control structures like service meshes. Any environment that fails on peak traffic is a suspect for rate monitoring.
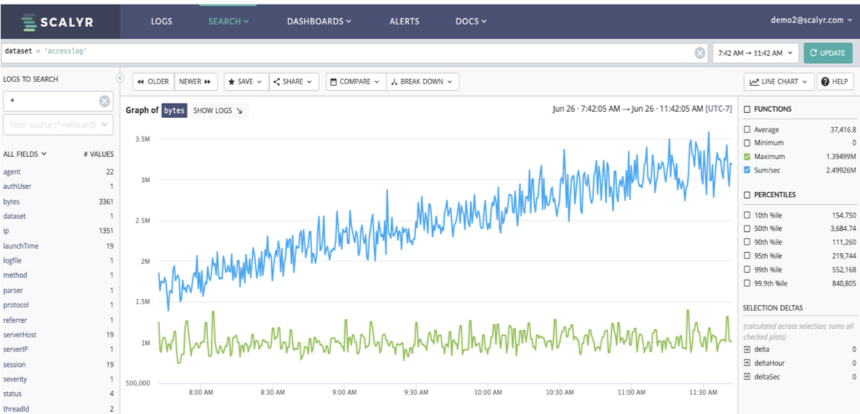
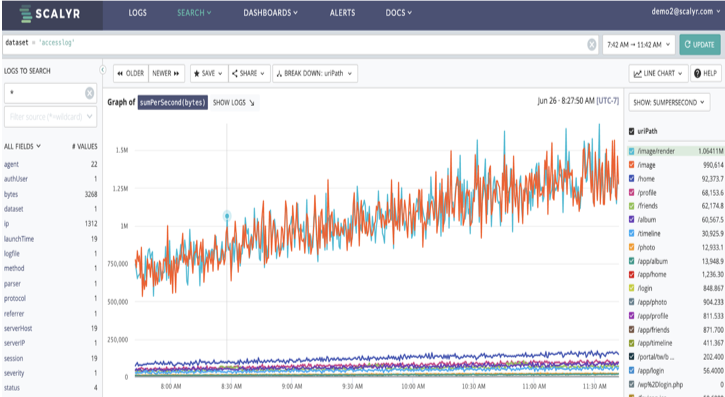
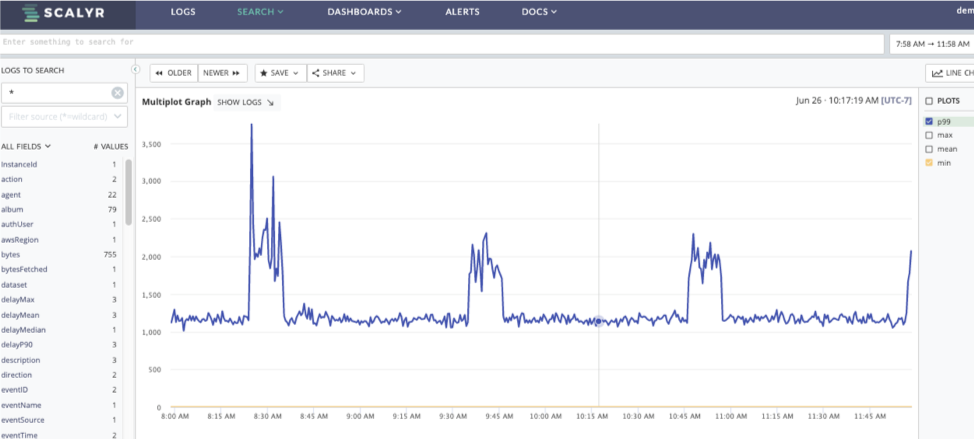
Here’s a dashboard measuring network bandwidth of an example e-commerce application. There are two different rate measurements shown, a total of all the bandwidth used and the maximum single point used.
This is useful in seeing what is going on in a single view. But what a straightforward metric approach fails to show is what is using the bandwidth. A deeper dive into related data is required.
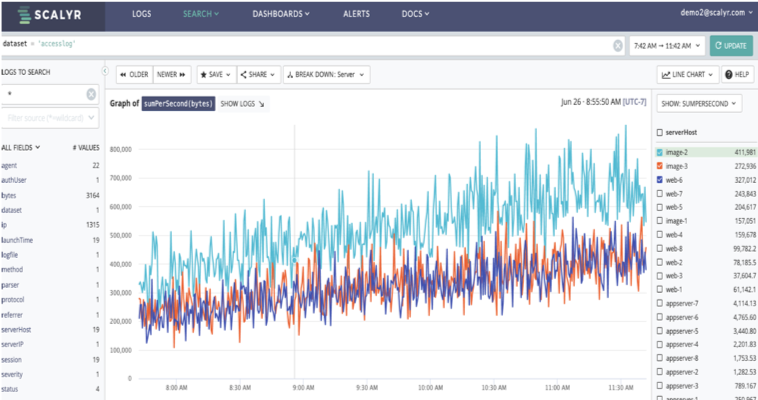
Since we can cross/breakdown our graph by other items, we can find our top servers, or our top uirpaths, as an example. In this case, our top paths are both related to images and our top servers are also image system. Images tend to be large, so we may not be able to reduce the bandwidth use. But we might want to figure out why we have a web server up with there as well (web-6).
With rate breaches, you need to move quickly from the metric measurements to a specific cause, be they in your own services or external factors. And since loads may be temporal, you need to be able to dig into the potential causes after the fact. Just a metric isn’t enough, you’ll need detailed info as well.
Errors are just what it says, problems that cause an incorrect, incomplete or unexpected result. They are failures in the code, bugs that appear under production loads (or under peak loads). Errors require rapid response. They require point specific responses. And while errors can be measured as a metric, you will need to dive deep into the structure and get to your root cause as soon as possible. If your business is dependent on the system that failed, ASAP might not even be fast enough.
And BTW, errors can also result in signal anomalies in rate and duration or be discovered by those self-same anomalies.
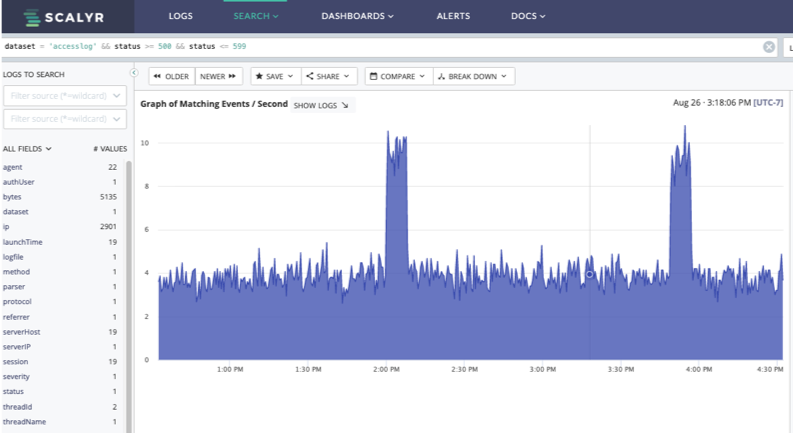
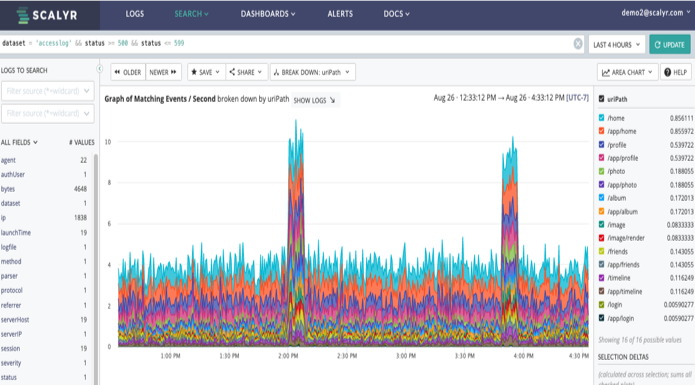
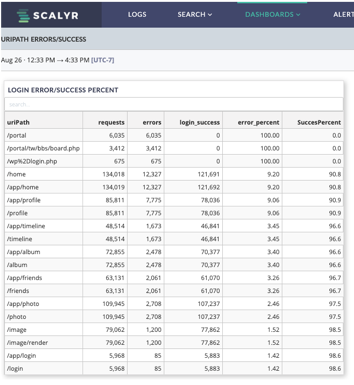
Errors can be reported by almost any service or application. Here we are looking at the errors reported by one of our web servers. While this may be acceptable, we can quickly drop into the data to determine what is going on and determine the current and ongoing impact as well as highlight areas to focus on for improvement.
Not responding to errors rapidly and specifically result in lost business and stressed DevOps/SRE teams.
Duration speaks of time. In particular, time to send and receive a specific request. And both client-side and server-side are important in meeting your customers’ desires.
Often this is relegated to distributed request tracing. And while each individual trace is important, so is the sum of the latency experienced across the entire environment. A High Latency Trigger (HLT) in one spot can cause a cascading HLT across the entire system.
So here we have some significant spikes in response time showing up. In an e-commerce setting, slow response to a request is a bad thing. Five seconds can lose a sale; ten seconds could get people to complain to their friends. So it is imperative to find out just what is going on, quickly and easily
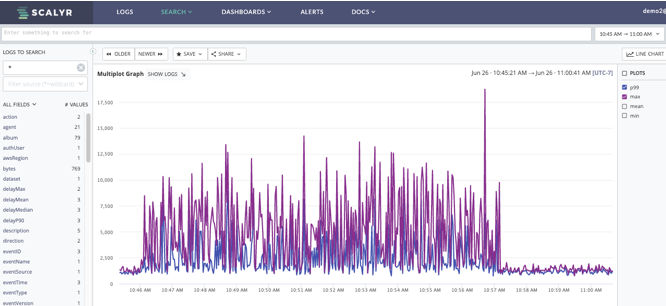
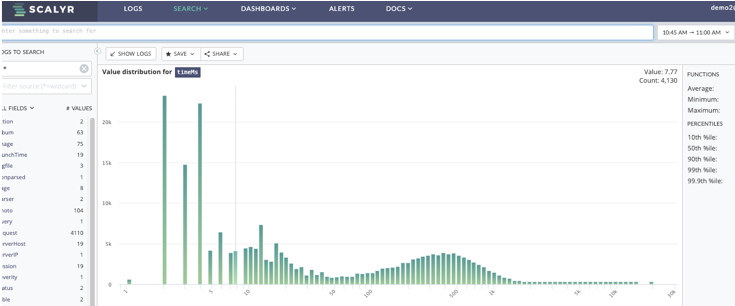
So here we have two graphs showing response times. The one on the top does indicate certain spikes while the one on the bottom is the distribution of response times. While the vast majority are good, there is a long tail showing some significant delays.
So what is the problem? Dropping into the consolidated logs for a selected transaction shows that we are hitting an invalid cache error on an appserver. From here we can drill into the code to determine the resolution required.
In today’s instant gratification world, a slow response is bad. So, you need to identify not only the headache (alert) but identify and narrow to the culprit as fast as possible.
With RED, while there can be many alerts, it follows that there are two major categories that apply broadly, anomaly alerts and headache alerts.
Rate is most often an anomaly alert. You’re alerting on something that has crossed a threshold, usually a percentage value. Rate often requires an intricate web of grouping and calculation. For example, is inbound traffic overwhelming the entry portals? You’d need to be able to see the sum of the total traffic across all of the portals and the ability to deep dive into each portal would be a significant advantage. The risk here is that the alert may not get processed in real-time.
As a caveat, anomaly alerts are new, and often do not often consider seasonality. They require aggregation, especially when going for the root cause. This is where visualization for humans is vital, as we are still pretty unmatched at pattern recognition and extrapolation.
Also, keep in mind that too low may be as indicative as too high. Low saturation at normal high-volume times is a definite flag.
Duration and errors are most accurately retrieved via logs (after all, a distributed trace is really just a specialized log entry).
Duration crosses the streams, being both an anomaly alert and a headache alert. It’s worthwhile to keep an eye on the total duration/latency of a request as well as on crucial services. While it may be difficult, being able to see duration from the client through the app environment is incredibly useful.
Often today, duration is aligned to distributed (request) tracing. Within that realm, it is easy to gather and visualize the respect latency by unique trace ID and by segment. However, since the formalized methods of distributed tracing (like OpenTracing and OpenCensus, now OpenTelemetry) require investment in instrumenting your code (and aligned services) it can require a significant effort to fully implement. It is not necessary to take the giant step to distributed tracing since in many cases you already have sufficient data for duration already logged.
Errors (and to a point duration) are both headache alerts. Something needs fixing NOW, so get it done. Here you need the alert as fast as possible. You need the information that shows where it occurred, when it occurred and what was going on. Again, log aggregation and threaded displays are vital; sometimes the thing that caused a failure isn’t the thing that failed.
With errors, two things are especially worth calling out. First, you can’t know every possible error before it happens. Sometimes, a deep exploratory adventure awaits, where you need to move rapidly and freely while you find the path to the root cause. Make sure you “save” that journey as a search and alert to eliminate such possibilities in the future. Second, not all errors are directly attributable to the failed service. Be ready to jump from app to infrastructure to service as necessary.
So RED gives you the framework to build alerting, monitoring and analysis into a flexible structure to meet the emerging needs of services-based architectures as well as give you the capability to grow as your environment scales. By combining the multiple dimensions of information that RED provides means faster time to recognition and faster time to resolution.