|
|
Log analytics is the process of analyzing aggregated log data to extract knowledge from them. Continuing the long and somewhat unfortunate Microsoft tradition of naming their services after what they do, Log Analytics is also the name of a service by Microsoft that helps you collect and analyze log data from Azure.
So, that’s what today’s post is all about: log analytics. We’ll offer you a guide on this term, covering both of its “flavors,” if you will. We’ll start with the Azure service, explaining what it is and how it works. Then, we go on to cover “log analytics” as a concept. We’ll define it in more detail, walk you through the motivations behind its use, and giving you tips on how to get started.
What Is Log Analytics? The Microsoft Flavor
Microsoft Azure is a collection of cloud computing services by Microsoft, being a competitor of Amazon AWS and Google Cloud. It shouldn’t come as a surprise that Azure generates log data, which you can analyze to obtain insights. That’s the job of Log Analytics, the service.
What Is Microsoft Log Analytics?
Log Analytics, in short, is a service for querying and analyzing log data in Azure. It’s a part of Azure Monitor, which is a solution that allows you to collect and analyzing telemetry data from both your cloud and on-premises environments.
With Log Analytics, you can write queries using its custom query language called Kusto. Then, you can run your queries and do all sorts of useful things with the results you get back. You can not only filter, sort, and group them but also create and share visuals—e.g., charts and graphs—of them.
It’s also possible to save, copy, load, and share not only the results themselves but also the queries that originated them.
What Is Kusto Query Language?
Kusto Query Language (KQL) is the custom query language you have to use to query the Azure log databases. So, if you’re working with Azure Monitor Applications Insights, Azure Monitor Logs (which includes Log Analytics), among other services, KQL is your new buddy.
Here’s a simple example of KQL, in which we search for the currencies of error in a table called Event:
Event
| search "error"
Here’s a more involved example, straight out from an Azure Log Monitor demo environment, which filters and summarize the data from a Usage table:
// Billable performance data
// Calculate the volume of billable data (in GB) for Perf data, over the last day.
Usage
| where TimeGenerated > ago(1d)
| where IsBillable == true
| where DataType == "Perf"
| summarize TotalVolumeGB = sum(Quantity) / 1024
Let’s see a final example:
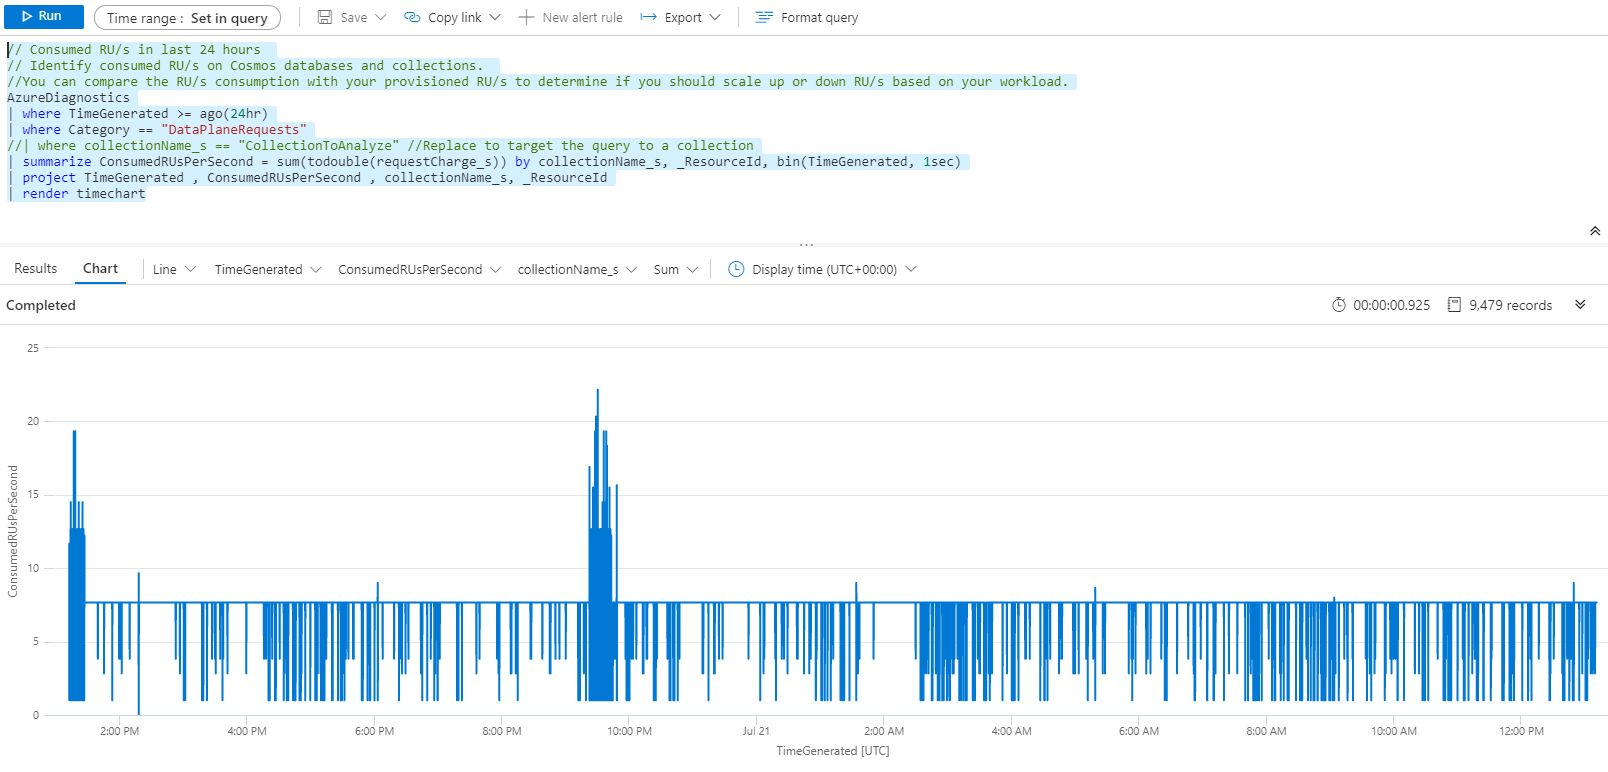
// Consumed RU/s in last 24 hours
// Identify consumed RU/s on Cosmos databases and collections.
//You can compare the RU/s consumption with your provisioned RU/s to determine if you should scale up or down RU/s based on your workload.
AzureDiagnostics
| where TimeGenerated >= ago(24hr)
| where Category == "DataPlaneRequests"
//| where collectionName_s == "CollectionToAnalyze" //Replace to target the query to a collection
| summarize ConsumedRUsPerSecond = sum(todouble(requestCharge_s)) by collectionName_s, _ResourceId, bin(TimeGenerated, 1sec)
| project TimeGenerated , ConsumedRUsPerSecond , collectionName_s, _ResourceId
| render timechart
Notice how it ends with the “render timechart” instruction. That’s a handy way of generating visualizations for your queries. The example above generates the following chart:
Is Azure Log Analytics Free?
In short, no. You can see the pricing in more detail, but the TL;DR version is that Azure monitoring is a paid service. When it comes to the Log Analytics part specifically, you pay based on ingestion and retention. In other words, how much data you ingest and for how much time you keep it.
The good news is that there are no up-front costs, nor termination fees. You pay as you go depending on how much you use.
What Is Log Analytics? The Broader Answer
Having walked you through a definition of Azure’s Log Analytics, let’s now cover the broader concept of log analytics. We start by defining it. Then we walk you through the main motivations behind its use. Before wrapping up, we give you some tips on how to get started with log analytics in practice.
Defining Log Analytics
We’ve already sort of defined log analytics in our introduction for the post. But tet’s go a bit deeper. What does log analytics involve? What are its main components?
The first crucial component of log analytics is searching. Even a small to medium-sized organization can generate gigabytes worth of log data every day. That’s particularly true when the organization
aggregates log data from many different sources, which is a thing you should be doing, by the way. Without efficient and fast searching capabilities, finding the information you need would be akin to searching for a needle in a haystack—only there are thousands of similar-looking needles, and the haystack itself grows and changes by the second.
The most important component of log analytics is the analysis itself, which is the raison d’être of the whole process.
The third main component of log analytics is visualization. As they say, a picture is worth a thousand words, but when it comes to log analytics, a visually stunning and easy to understand chart can be such a powerful way of conveying information than even ten thousand words couldn’t be a match for it.
Motivations
The main motivation behind log analytics is that if you don’t do it you’re wasting an enormous potential. Your log data might be able to give you a unique glimpse into your every facet of your organization, and that’s especially true when you have centralized logging. Using your logging strategy as a mere troubleshoot helper is unfortunate since instead of just putting out fires, you have the opportunity to prevent them from happening in the first place.
So, specifically speaking, here are some of the benefits and use cases for log analytics:
- Discover patterns in user behavior. Understanding how users behave when using the application is valuable, both from a UX perspective (i.e., it allows organizations to improve the usability and user experience of their apps) and from a sales perspective (by better understanding the user, you can create opportunities of further engagements, such as tailored recommendations.)
- Find security breaches. By analyzing security logs, it’s possible to detect attempts to breach security.
- Detect suspicious behavior. Log analytics and monitoring might help detect suspicious behavior, such as a user attempting to log in simultaneously from two different places, or trying to make a purchase that doesn’t match the user’s typical behavior.
- Real-time monitoring and alerting. It’s possible to use log analytics to identify patterns that might result in problems and create specific alerts for those patterns. That way, you might be able to act preemptively and stop a problem before it gets critical.
How Log Analytics Work
Log analytics is part of an overall log management strategy. Such a strategy will definitely include log collection, which is the first step in the journey to log analytics.
When your log data is all in one place, it’s time for it to be aggregated. Think about it: just having lots of log files from entirely different sources together doesn’t make you any good. They might use different formats for dates and times. Also, they most likely won’t use the same naming conventions for the log levels. While some of them might follow well-established logging best practices, others might not. Log aggregation is your friend here: it helps you smooth out all of those differences, normalizing the variety of log formats into a canonical representation, then parsing all of that to be able to treat your log data as…well, as data, instead of just plain text.

Finally, you can use your tool of choice to perform log analytics. By using techniques like pattern recognition, classification, tagging, correlation analysis, and artificial ignorance, among others, your log analytics tool will allow you to run queries against your logs and manipulate the results in ways that enable you to extract insights from them.
How to Get Started
The first step to getting started with log analytics is adopting logging itself. We’ve published many posts on how to get started with logging on a variety of programming languages, from C# and Java to Python, Ruby, Node.js, and a lot more. There’s no reason not to use logging, so if you don’t, start right away.
After that, you should prepare your logs for consumption by being kind to them. Use log levels correctly, keep your logs well-formatted, and follow general logging best practices. Once you have a healthy logging strategy in place, the only step left is to find a good tool to help you. And though there are many available options, we want to suggest Scalyr.
Scalyr’s offering is a complete log management solution that offers fast ingest and search, real-time monitoring, powerful querying capabilities, and a smooth learning curve despite all of that power. Give it a try today.
You Might Not Need Log Analytics…But You’d Better Use Log Analytics!
In today’s post, you’ve learned the difference between Log Analytics and log analytics. While the former is a specific Azure service, the latter is the overall concept, universally useful and tech stack agnostic.
Now you understand more about both the Microsoft service and the general log analytics technique. And while Log Analytics might or might not be useful for you, log analytics is a must if you and your organization want to make the most out of your logging strategy.
Thanks for reading.