|
|
Zipkin is a Java-based distributed tracing system to collect and look up data from distributed systems. Too many things could happen when a request to an HTTP application is made. A request could include a call to a database engine, to a cache server, or any other dependency like another microservice. That’s where a service like Zipkin can come in handy. An application could be sending timing data in the background so that when it’s time to troubleshoot, you can have an integrated view with Zipkin.
In this post, you’ll learn what Zipkin is and why it matters in a microservices or a distributed system architecture. Then, following the example application I used for the OpenCensus guide, you’ll learn how to send and view traces in Zipkin.
What Is Distributed Tracing?
We’ve opened the post by saying that Zipkin is a distributed tracing system. Before we go any further, it might make sense to define what distributed tracing is, so we’re all on the same page.
As its name suggests, distributed tracing is a specific type of tracing, i.e. a technique you use to monitor and profile applications. The “distributed” moniker refers to the types of applications we’re talking about: namely, apps built under a distributed or microservice architecture.
Thanks to distributed tracing, teams can track a single request through an application, from the moment the transaction reaches the “edge” of the application—e.g. when a request hits an API endpoint—until it’s completed. By following requests closely, IT teams can quickly detect—and, hopefully, fix—any anomalies that might negatively impact the application’s behavior.
What Is Zipkin?
Zipkin is an open source distributed tracing system based on Dapper’s paper from Google. Dapper is Google’s system for its system distributed tracing in production. Google explains this in their paper—they “built Dapper to provide Google’s developers with more information about the behavior of complex distributed systems.” Observing the system from different angles is critical when troubleshooting, especially when a system is complex and distributed.
Zipkin helps you find out exactly where a request to the application has spent more time. Whether it’s an internal call inside the code or an internal or external API call to another service, you can instrument the system to share a context. Microservices usually share context by correlating requests with a unique ID. Furthermore, in a case where systems are too big, you can opt in to work only with sample data to reduce the overhead in the system.
For example, a request to a microservice could have taken longer than the usual time (one minute). With Zipkin, you can easily learn whether the application spent most of its time querying the database. If you dig deeper, you might find out that what happened was that the cache server was down. All calls were being made directly to the database, increasing the latency of the microservice.
Now, let’s take a look at Zipkin’s components to understand more how the timing data arrives at Zipkin.
Zipkin Architecture Components
Zipkin is not just a tool to graphically view a system’s traces. It might help to learn more about Zipkin’s components to understand why Zipkin won’t degrade your application’s performance. Let’s start by determining what happens when a request to an API is sent to Zipkin. Well, first someone needs to add instrumentation to the code. Zipkin has official and community libraries for the majority of programming languages. You only need to learn how to integrate it into your code. Then, let the magic happen.
As soon as the request ends—and before the user receives a response—Zipkin sends a trace as a single span asynchronously to the collector (keep reading to learn more on that). Usually, the trace is sent through the HTTP protocol with the context headers. If the code makes a call to another service that uses OpenCensus and Zipkin, that other request will receive the headers. That’s how Zipkin group traces.
A collector is a daemon that validates and indexes the data in the storage. Storage is a pluggable component that can be Cassandra, Elasticsearch, or MySQL. Once the data is persisted, the query service provides a JSON API that anyone could use to search for traces. When you install Zipkin, it comes with an accessible user interface (UI) that anyone could use when troubleshooting.
It might look like performance will be degraded by having instrumentation that sends traces to Zipkin. Truth be told, it could, but remember that you also have the option to sample the traces. I’d advise you to always run a performance test before and after adding distributed tracing.
Let’s see now how to integrate distributed tracing into an application by using OpenCensus and Zipkin.
Distributed Tracing With OpenCensus and Zipkin
I’ll continue using the simple Go HTTP API I used in the OpenCensus post; you can find the latest version of the code at Github under https://github.com/christianhxc/opencensus-golang-tutorial. I’ll explain each section of the code that I had to add to send traces to Zipkin.
1. Pre-Requirements: Install and Configure
To make this guide easier to follow, I decided to use the following:
- Docker, which will help you run the other tools we’ll use more easily.
- Go tools to build and run the sample application.
After installing Go, let’s get the OpenCensus libraries in your local environment. Run this command:
go get -u -v go.opencensus.io/...
Now you’ll be able to import the libraries for Zipkin and add it to the application code.
2. Instrument a Go HTTP API With OpenCensus
I’ll include the final version of the code (the combination of all these code snippets) at the end of this section. In case this gets confusing along the way, you can always use that. Or you could also clone the Github repo locally and run the application.
In the main.go file, add the following code into the import section:
"go.opencensus.io/exporter/zipkin" "contrib.go.opencensus.io/trace" openzipkin "github.com/openzipkin/zipkin-go" zipkinHTTP "github.com/openzipkin/zipkin-go/reporter/http"
The above code includes the OpenCensus libraries for Zipkin and tracing, as well as the official libraries to send traces to Zipkin.
For reading purposes, create a function to register Zipkin as an exporter:
func registerZipkin(){
	localEndpoint, err := openzipkin.NewEndpoint("golangsvc", "192.168.1.61:8080")
 	if err != nil {
		log.Fatalf("Failed to create Zipkin exporter: %v", err)
 	}
 	reporter := zipkinHTTP.NewReporter("http://localhost:9411/api/v2/spans")
 	exporter := zipkin.NewExporter(reporter, localEndpoint)
	trace.RegisterExporter(exporter)
	trace.ApplyConfig(trace.Config{DefaultSampler: trace.AlwaysSample()})
}
Include the call to this function into the “main()” function. As you can see, the function doesn’t require any parameters. And that’s it. When you run the application, every time you hit the “/list” endpoint a trace will be sent to Zipkin—you won’t have to add anything else to the code.
If you want to use sample traces, remove the line “trace.ApplyConfig(trace.Config{DefaultSampler: trace.AlwaysSample()})”. Otherwise, with this line a trace will be sent in every request.
But wait a second—what if you need more details of what happens in each request? If it’s a call to an external API, you need to make sure that the other service sends traces to Zipkin. If not, just for fun I added a few other dummy functions to mimic calls to another dependency like the cache, database, or another microservice.
For example, look closely at the cache function:
func cache(r *http.Request) {
	_, span := trace.StartSpan(r.Context(), "cache")
	defer span.End()
	time.Sleep(time.Duration(rand.Intn(100)+1) * time.Millisecond)
}
You’ll see that I added this code to report a span: “_, span := trace.StartSpan(r.Context(), “cache”)”. If there’s an existing Zipkin header, the span will be considered part of the same context. Don’t worry; it’s going to be clear when you see the whole code and the trace in Zipkin’s UI.
The complete code of “main.go” will look like this:
package main import ( "log" "math/rand" "net/http" "strings" "time" "contrib.go.opencensus.io/exporter/prometheus" "contrib.go.opencensus.io/exporter/zipkin" "go.opencensus.io/plugin/ochttp" "go.opencensus.io/stats/view" "go.opencensus.io/trace" openzipkin "github.com/openzipkin/zipkin-go" zipkinHTTP "github.com/openzipkin/zipkin-go/reporter/http" ) func registerPrometheus() *prometheus.Exporter { pe, err := prometheus.NewExporter(prometheus.Options{ Namespace: "golangsvc", }) if err != nil { log.Fatalf("Failed to create Prometheus exporter: %v", err) } view.RegisterExporter(pe) return pe } func registerZipkin(){ localEndpoint, err := openzipkin.NewEndpoint("golangsvc", "192.168.1.61:8080") if err != nil { log.Fatalf("Failed to create Zipkin exporter: %v", err) } reporter := zipkinHTTP.NewReporter("http://localhost:9411/api/v2/spans") exporter := zipkin.NewExporter(reporter, localEndpoint) trace.RegisterExporter(exporter) trace.ApplyConfig(trace.Config{DefaultSampler: trace.AlwaysSample()}) } func main() { pe := registerPrometheus() registerZipkin() mux := http.NewServeMux() mux.HandleFunc("/list", list) mux.Handle("/metrics", pe) h := &ochttp.Handler{Handler: mux} if err := view.Register(ochttp.DefaultServerViews...); err != nil { log.Fatal("Failed to register ochttp.DefaultServerViews") } log.Printf("Server listening! ...") log.Fatal(http.ListenAndServe(":8080", h)) } func list(w http.ResponseWriter, r *http.Request) { log.Printf("Serving request: %s", r.URL.Path) database(r) serviceb(r) res := strings.Repeat("o", rand.Intn(99971)+1) time.Sleep(time.Duration(rand.Intn(977)+1) * time.Millisecond) w.Write([]byte("Hello, w" + res + "rld!")) } func database(r *http.Request) { cache(r) _, span := trace.StartSpan(r.Context(), "database") defer span.End() time.Sleep(time.Duration(rand.Intn(977)+300) * time.Millisecond) } func cache(r *http.Request) { _, span := trace.StartSpan(r.Context(), "cache") defer span.End() time.Sleep(time.Duration(rand.Intn(100)+1) * time.Millisecond) } func serviceb(r *http.Request) { _, span := trace.StartSpan(r.Context(), "serviceb") defer span.End() time.Sleep(time.Duration(rand.Intn(800)+200) * time.Millisecond) servicec(r) } func servicec(r *http.Request) { _, span := trace.StartSpan(r.Context(), "servicec") defer span.End() time.Sleep(time.Duration(rand.Intn(700)+100) * time.Millisecond) }
3. Install Zipkin Locally
Let’s use Docker to run Zipkin locally. To do so, run the following command:
docker run -d -p 9411:9411 openzipkin/zipkin
Now open in the browser the following URL: http://localhost:9411/.
4. Generate Traces From the HTTP API
Once you have the code ready and Zipkin is running, let’s run the application with the following command:
go run main.go
In the browser, open the URL http://localhost:8080/list and refresh the page as many times as you wish to generate a trace every time you hit the “/list” endpoint.
5. View Traces in Zipkin
Go back to the Zipkin browser window and you should see something similar to this:
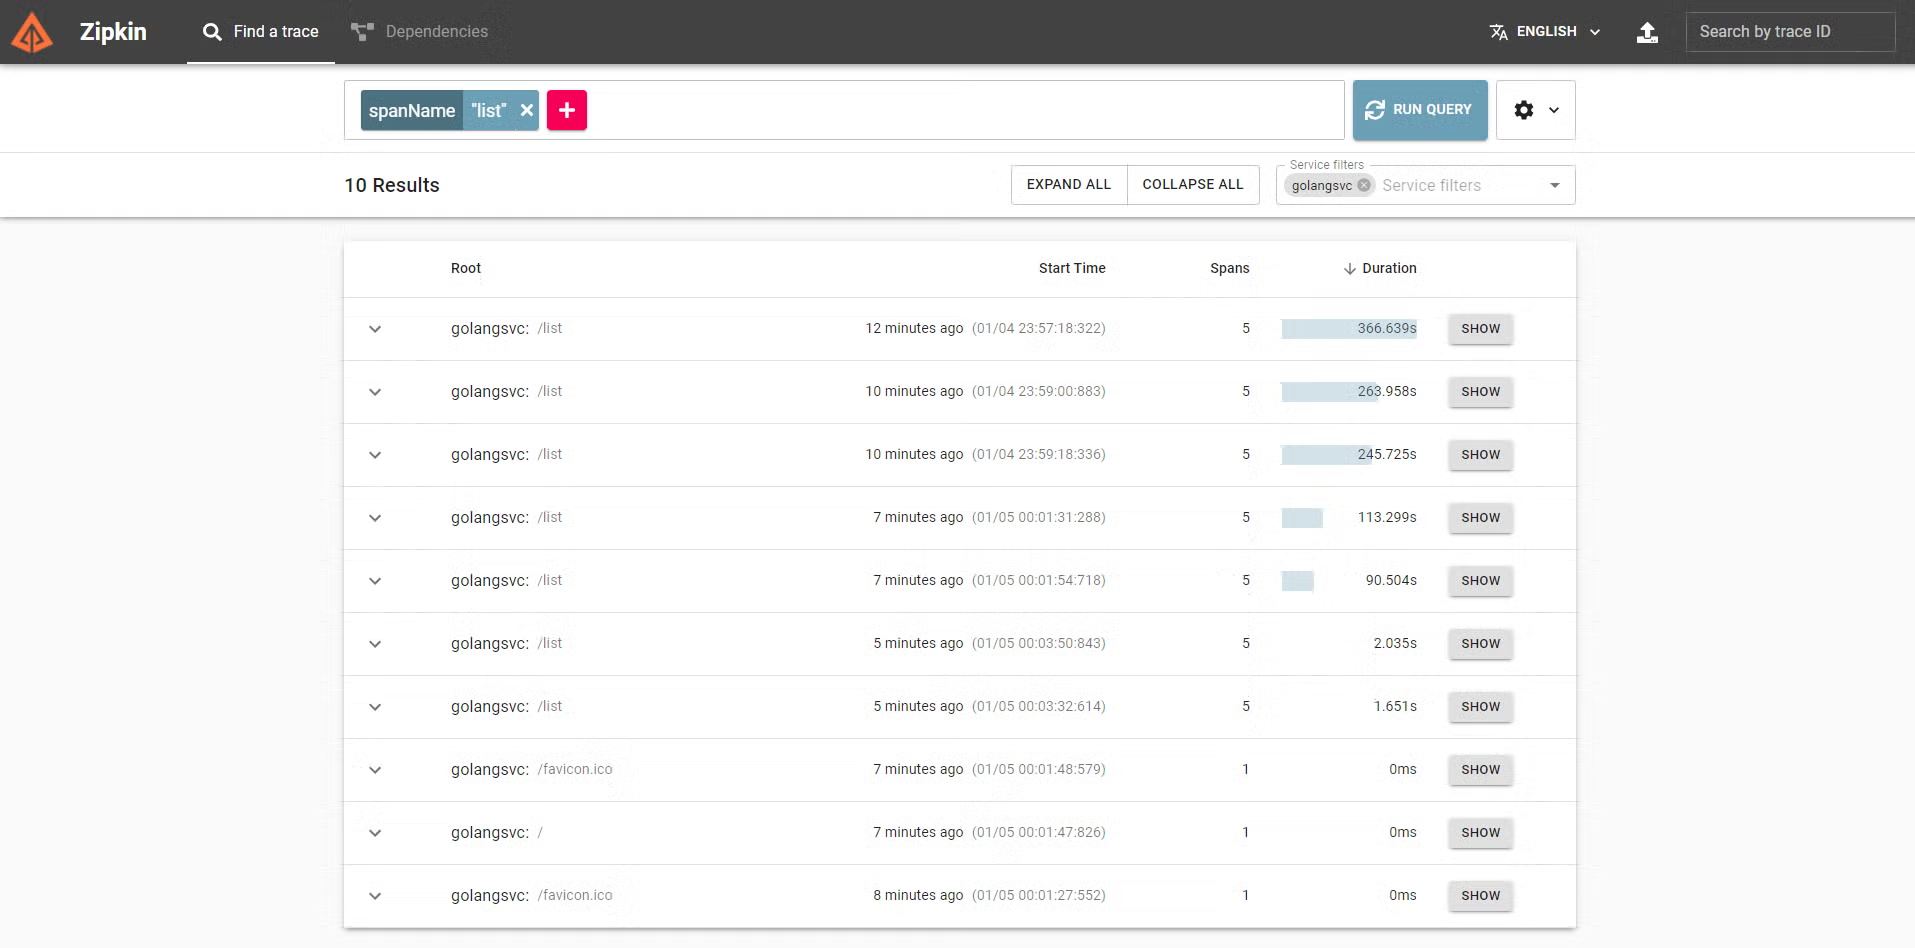
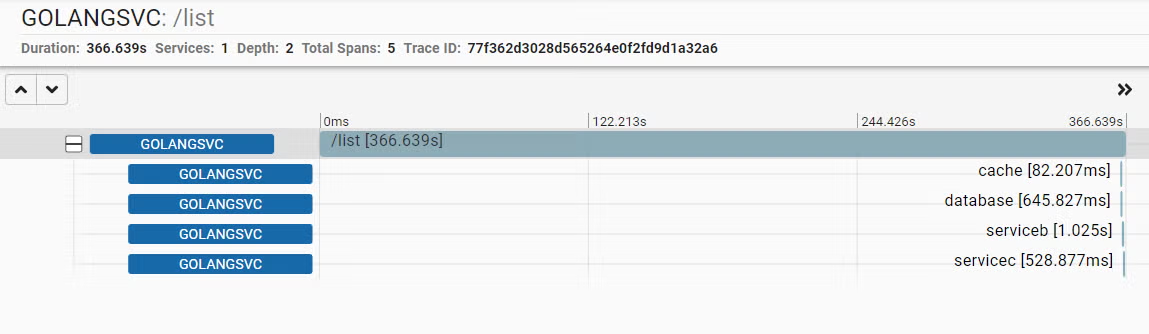
You can play with the filters to only see the traces for the path “/list” as I did. Then, select a trace and click on its SHOW button and you’ll see something like this:
Another option that works is that you can include the trace ID in the response payload of the application and use that ID when a customer complains that something happened in the system.
You can see how much time this request spent in each function. For example, you could say that the problem is with the call to the microservice and focus on reducing the latency in that service first. Or, you could use these traces to understand what the workflow of a request is.
What if you’re calling a dependency (such as a cache) more than once? With Zipkin, it’s easy to spot those type of issues.
Troubleshoot Distributed Systems With Zipkin
Don’t waste valuable time debugging your applications in production. When you instrument the code by adding traces you can easily spot almost any issue or at least have an idea of where the problem could be. I once used this approach—instrumenting code and getting traces for each request, that is—to find out that a microservice was calling another microservice inside a loop, increasing the service’s latency.
Developers or anyone interested in helping recover from a downtime could have access to the Zipkin UI and contribute to solving the problem. Having this type of detailed visibility helps a lot—you won’t be blind anymore when troubleshooting distributed systems.

After learning about Zipkin and distributed tracing, what should your next step be? Well, you might want to stick around at the Scalyr blog, where we often publish useful content related to topics like tracing, logging, monitoring, and observability.
While you’re at it, you might want to take a look at Scalyr’s offering, a comprehensive log management platform that can bring a lot of value to your organization.